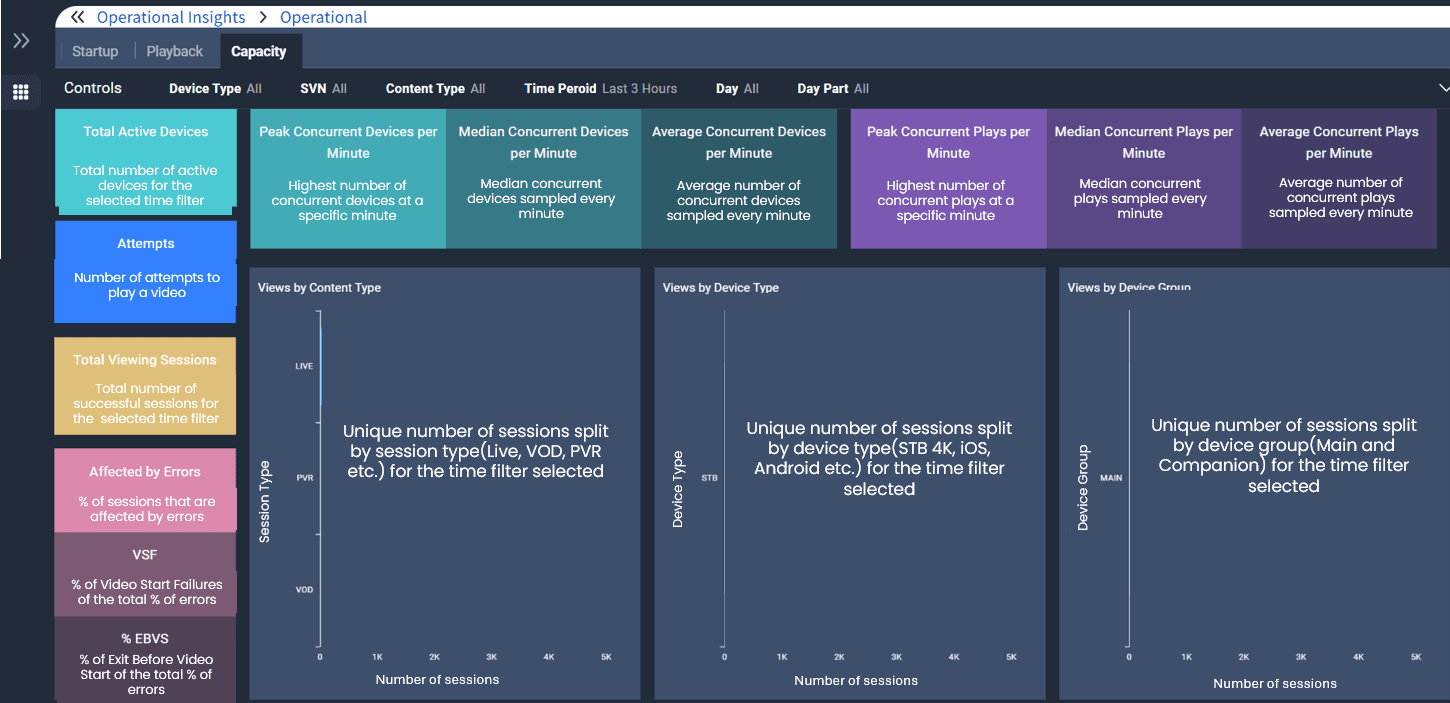
Capacity looks at total views and concurrency across services, device types, and time of day to show when peaks occur and what devices and content are driving those peaks.
Filters are provided for device group (Main, Companion, both), device type (specific type of device), session type, SVN (Software Version Number), time period (Last 24 hours, last 3 hours and last hour) and day part to refresh the numbers and charts across the dashboard.
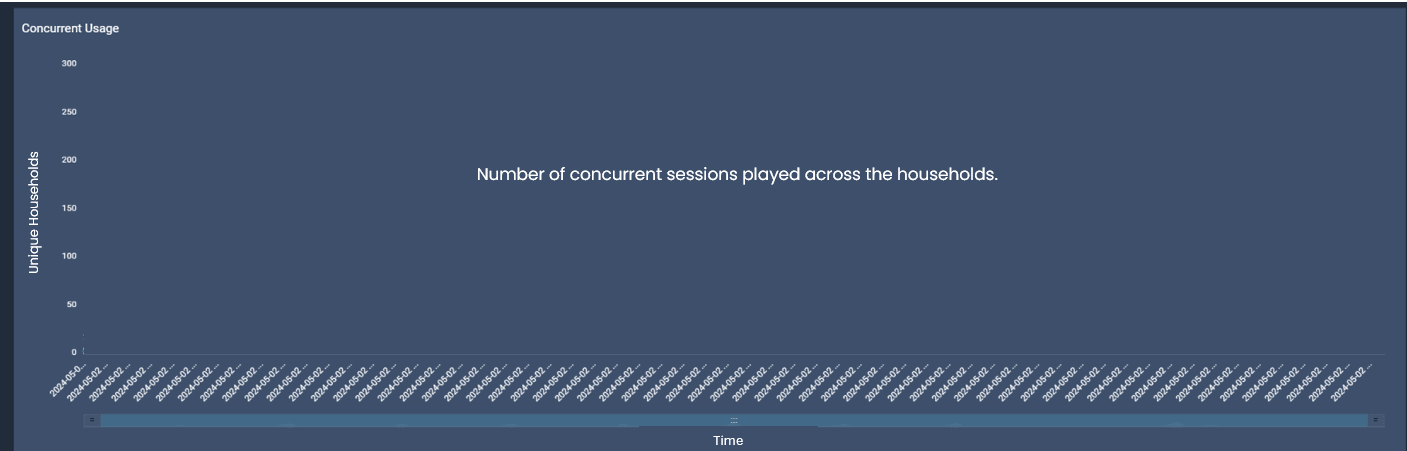
Total views by session type, device type and device group are displayed. Concurrent usage chart gives the number of concurrent sessions for the time filters applied to understand at what time of day peaks occur.
Tables for top channels, top linear content and top VOD asset are displayed to understand the peak consumption.
