
Login to Synamedia Cloud Portal with your credentials.
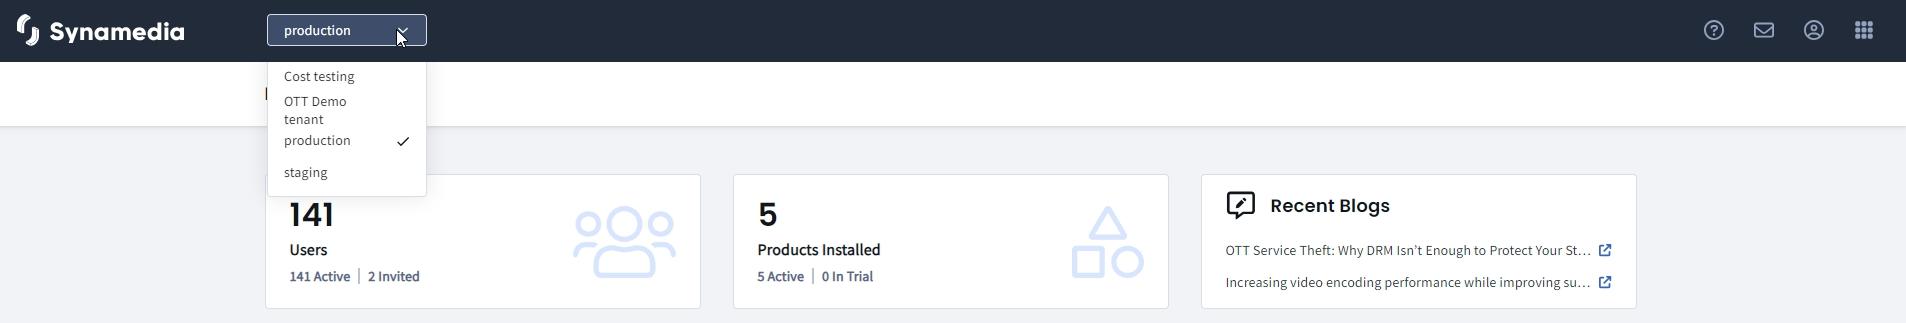
Select Production Environment from the dropdown.
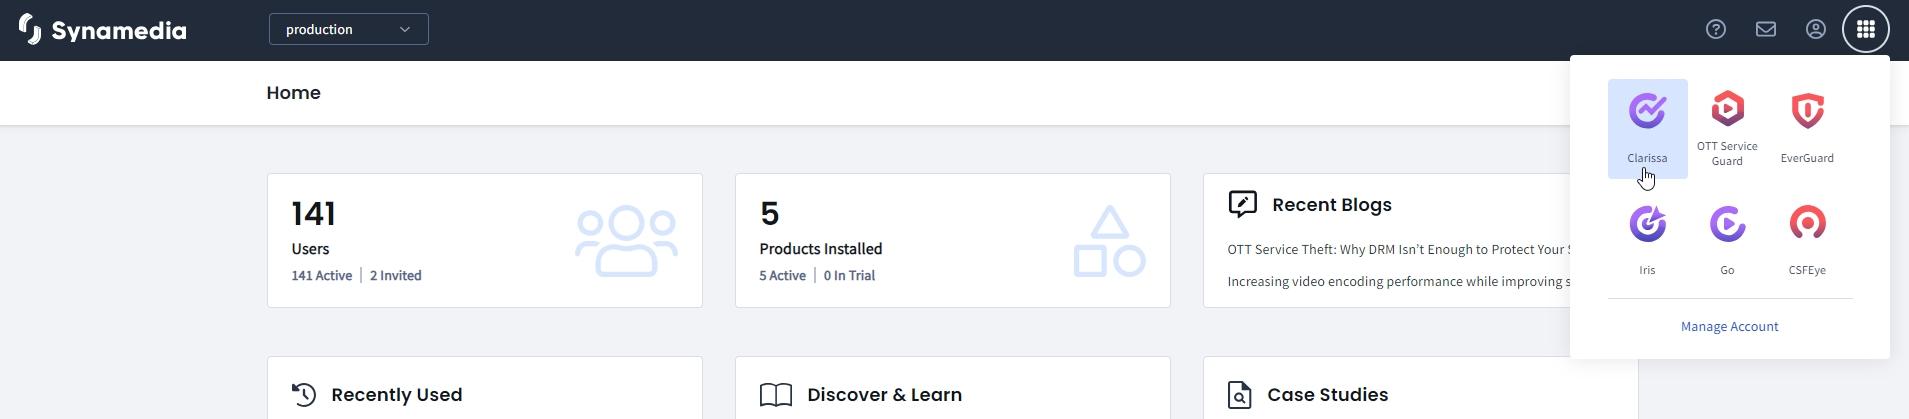
Click on the More Options button on the top right corner of the screen and choose Clarissa or by choosing Clarissa in the Recently Used card.
From the hub, launch the Clarissa app.
From the options available in the hub, choose Content Insights.
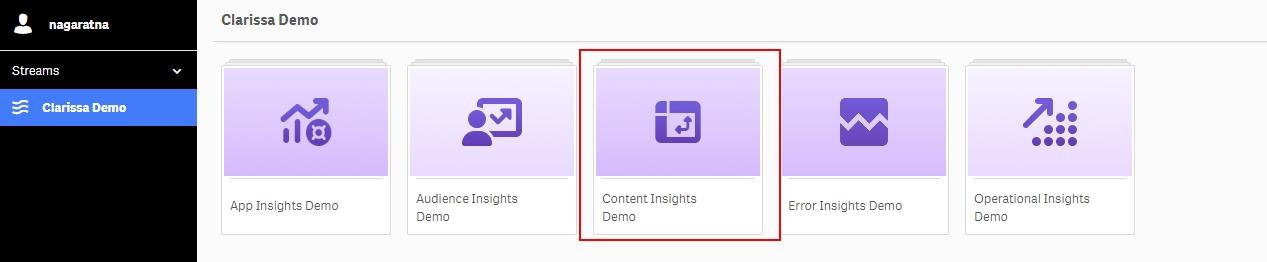
Content Insights is divided in 4 sheets:
Summary provides the high-level summary of the top metrics
Reach provides a comprehensive view of content consumption metrics across devices, households, and session types.
Trends is designed to facilitate the comparison of reach and duration between two distinct time periods, labelled as A and B.
Value focuses on channel performance and viewing patterns.
The Apps Insights dashboards aim to deliver insights into how users navigate to content. We identify how many decisive journeys there are and how many people take the long way around, including how many of those navigational journeys result in content being watched.
Select App Insights from the options available in the Hub.
Journeys classifies the navigational journeys into different types of journeys based on the duration and number of steps taken to land on a content for viewing
Screens gives insights into the UI screen which are part of the UI navigation like Menu areas, Swimlanes, Search screens etc.
Features offers Feature analytics overview for all the features available in the UI. KPIs covered are depth and breath of feature adoption, return to feature and content discovery using features.
Select Operational Insights from the options available in the Hub.
Startup sheet focuses on issues that might occur during the launch of a video asset, including lag time, failures, and exits before video start.
Playback sheet is to analyse the Quality of Experience (QoE) of watching video by examining the rebuffering rate and duration, as well as the average bitrate and playback errors.
Capacity looks at total views and concurrency across services, device types, and time of day to show when peaks occur and what devices and content are driving those peaks.
Select Operational Insights from the options available in the Hub.
Error Insights app searches for errors by type and volume and the distribution of these errors across devices, time of day, day of the week, and location over a 30-day period. Error insights App is rendered in a new browser tab and is displayed in 2 sheets:
Trends sheet focuses on the distribution of errors across the error types and categories and provides the error details.
Region sheet helps localize the error based on the region to understand the highly impacted regions.