
overview
what's new
getting started
other
Each application contains sheets which are a set of dashboards grouped under a theme. Within the sheet, there are a set of headline metrics that give you the main stats at a glance, with additional insights for that theme below.
Many dashboards also provide filters that when applied on any one sheet will carry-over to all the sheets within the application. This allows you to look at the impact a particular filter is having on all other dashboards. For example, the “Sports” Content Genre can be a filter to see its impact on not just Channel Importance, but also on Platform Reach and OTT Device Reach as well.
The Content Insights application comprises of four sheets that focus on different analysis areas:
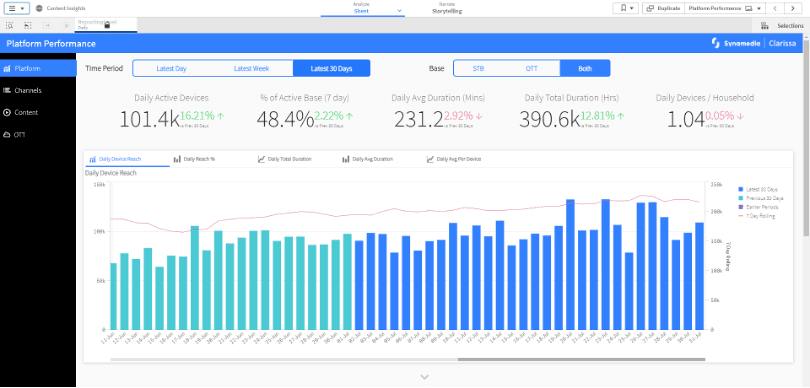
Platform Performance
Channel Analysis
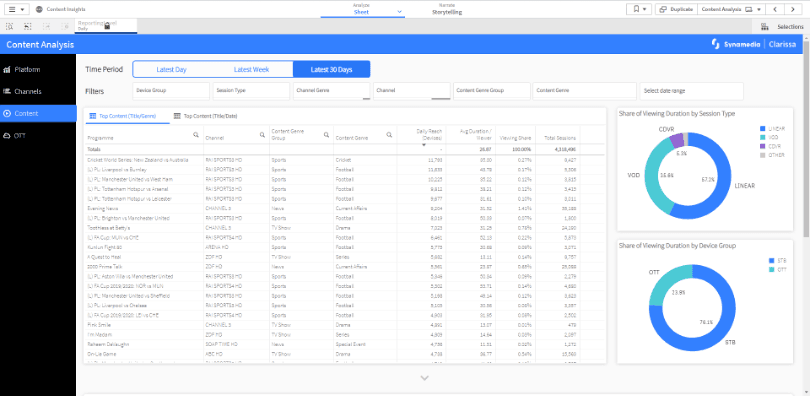
Content Analysis
OTT Analysis
This sheet brings together high-level statistics on device reach and viewing duration across all content and channels on a service provider’s platform. Headline metrics provide a quick view on system-wide consumption trends for reach and duration. Additional panels look at service types and devices per household. Filters allow you to select the time period for analysis and also the devices whose performance you want to understand.
This sheet can help you understand trends in channel viewing. Instead of looking at channel views by only duration (which can be skewed by long events like Grand Prix, Oscars), the Channel Importance metric looks at channels by how much they dominate a HH’s viewing over the selected period. This allows service providers to understand the relative importance of specific channels to their line-ups and packages, as well as how strongly their viewers value them.

This sheet looks to provide a more granular detail on type of viewing (live, VOD, DVR) and device mix (OTT, STB) for content. It allows you to explore how viewing behaviours change depending on content and channel genres. For example, News programs are likely to be consumed live and over the settop box.
OTT content consumption is the most flexible in terms of how it can be accessed and viewed. This dashboard breaks down the consumption statistics to enable service providers to see what devices are consuming their OTT offerings.