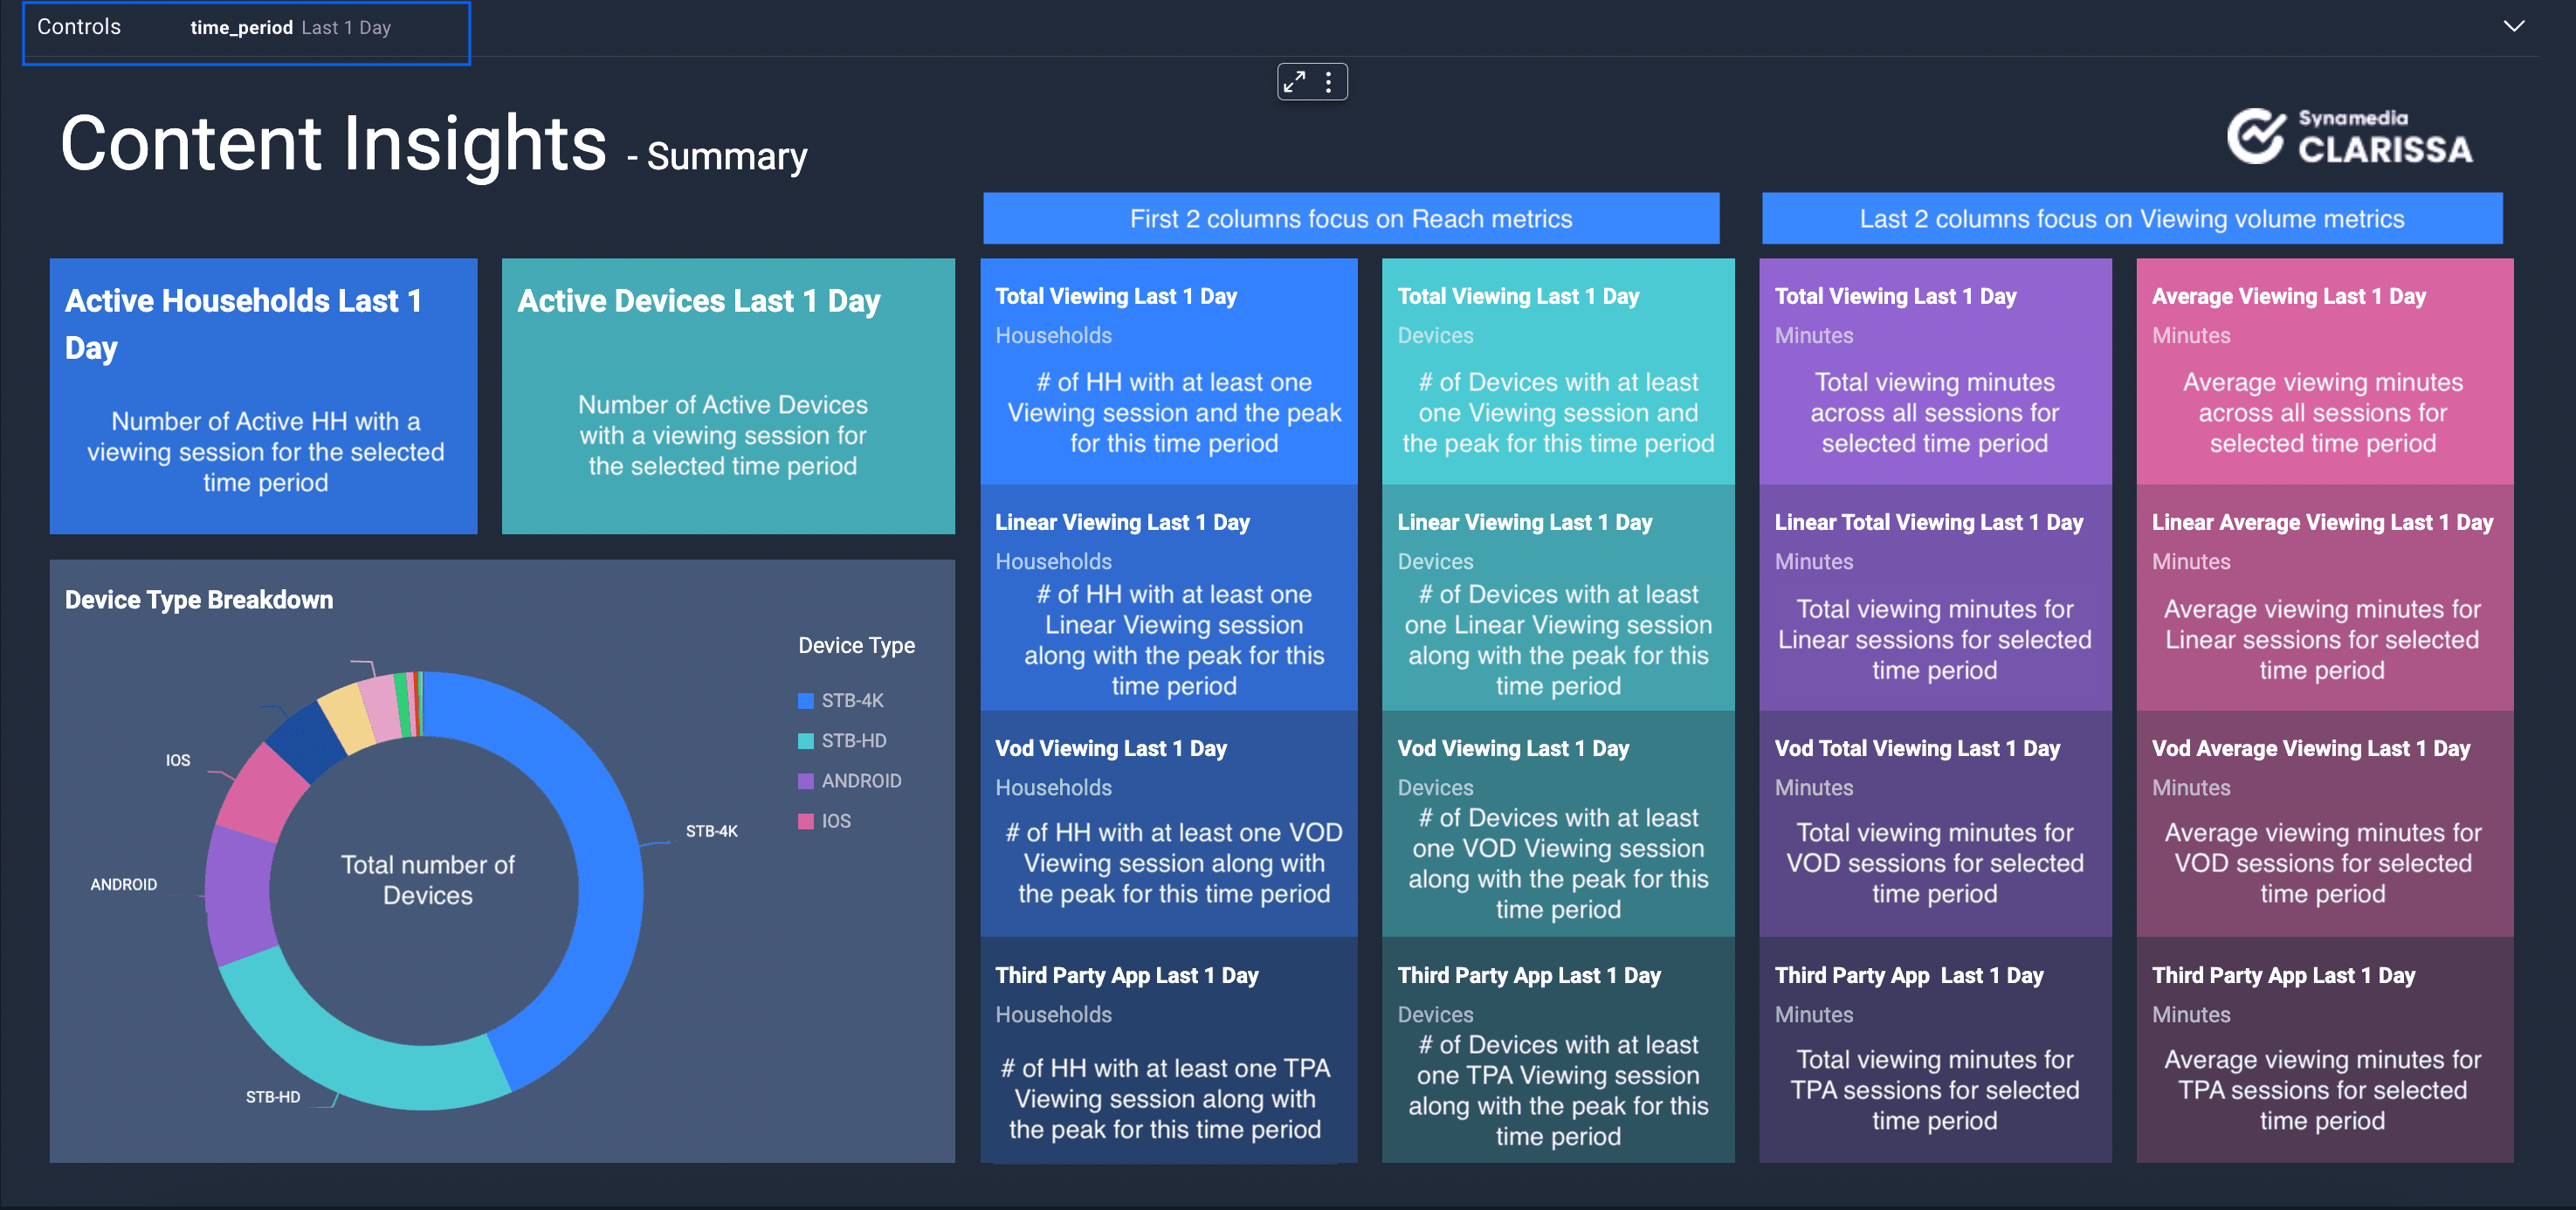
The Summary sheet is introduced into Content Insights to provide you with a quick look at the key KPI’s against Reach (number of households and devices) and Engagement (viewing minutes across different session types) for the last day, last week and last month.
We provide Total, Peak and Average metrics.
Peak is the highest value for the metric in the selected time period
Average is the average value of the metric for the selected time period.
When the selected duration is last day, Peak and Average will have the same value.
In a future iteration, we will be adding trend graphs against the main KPI’s.
Next article: Reach Sheet User Guide
