Operational Insights is focused on providing insights into service or application errors experienced by the subscriber.
The Operational Insights product requires that the service provider integrate the Synamedia Clarissa Client Library into their device applications. A standard library will be available through the developer portal for the following device types and will be backwards compatible with up to two prior OS versions:
iOS
Android and Android TV
Apple tvOS
JavaScript for browser-based applications
Linux-based STB
Although the Synamedia Clarissa Client Library can also be used in conjunction with other Clarissa Insights applications, data will only be retained and processed for the applications which are activated as part of the provider’s Clarissa subscription.
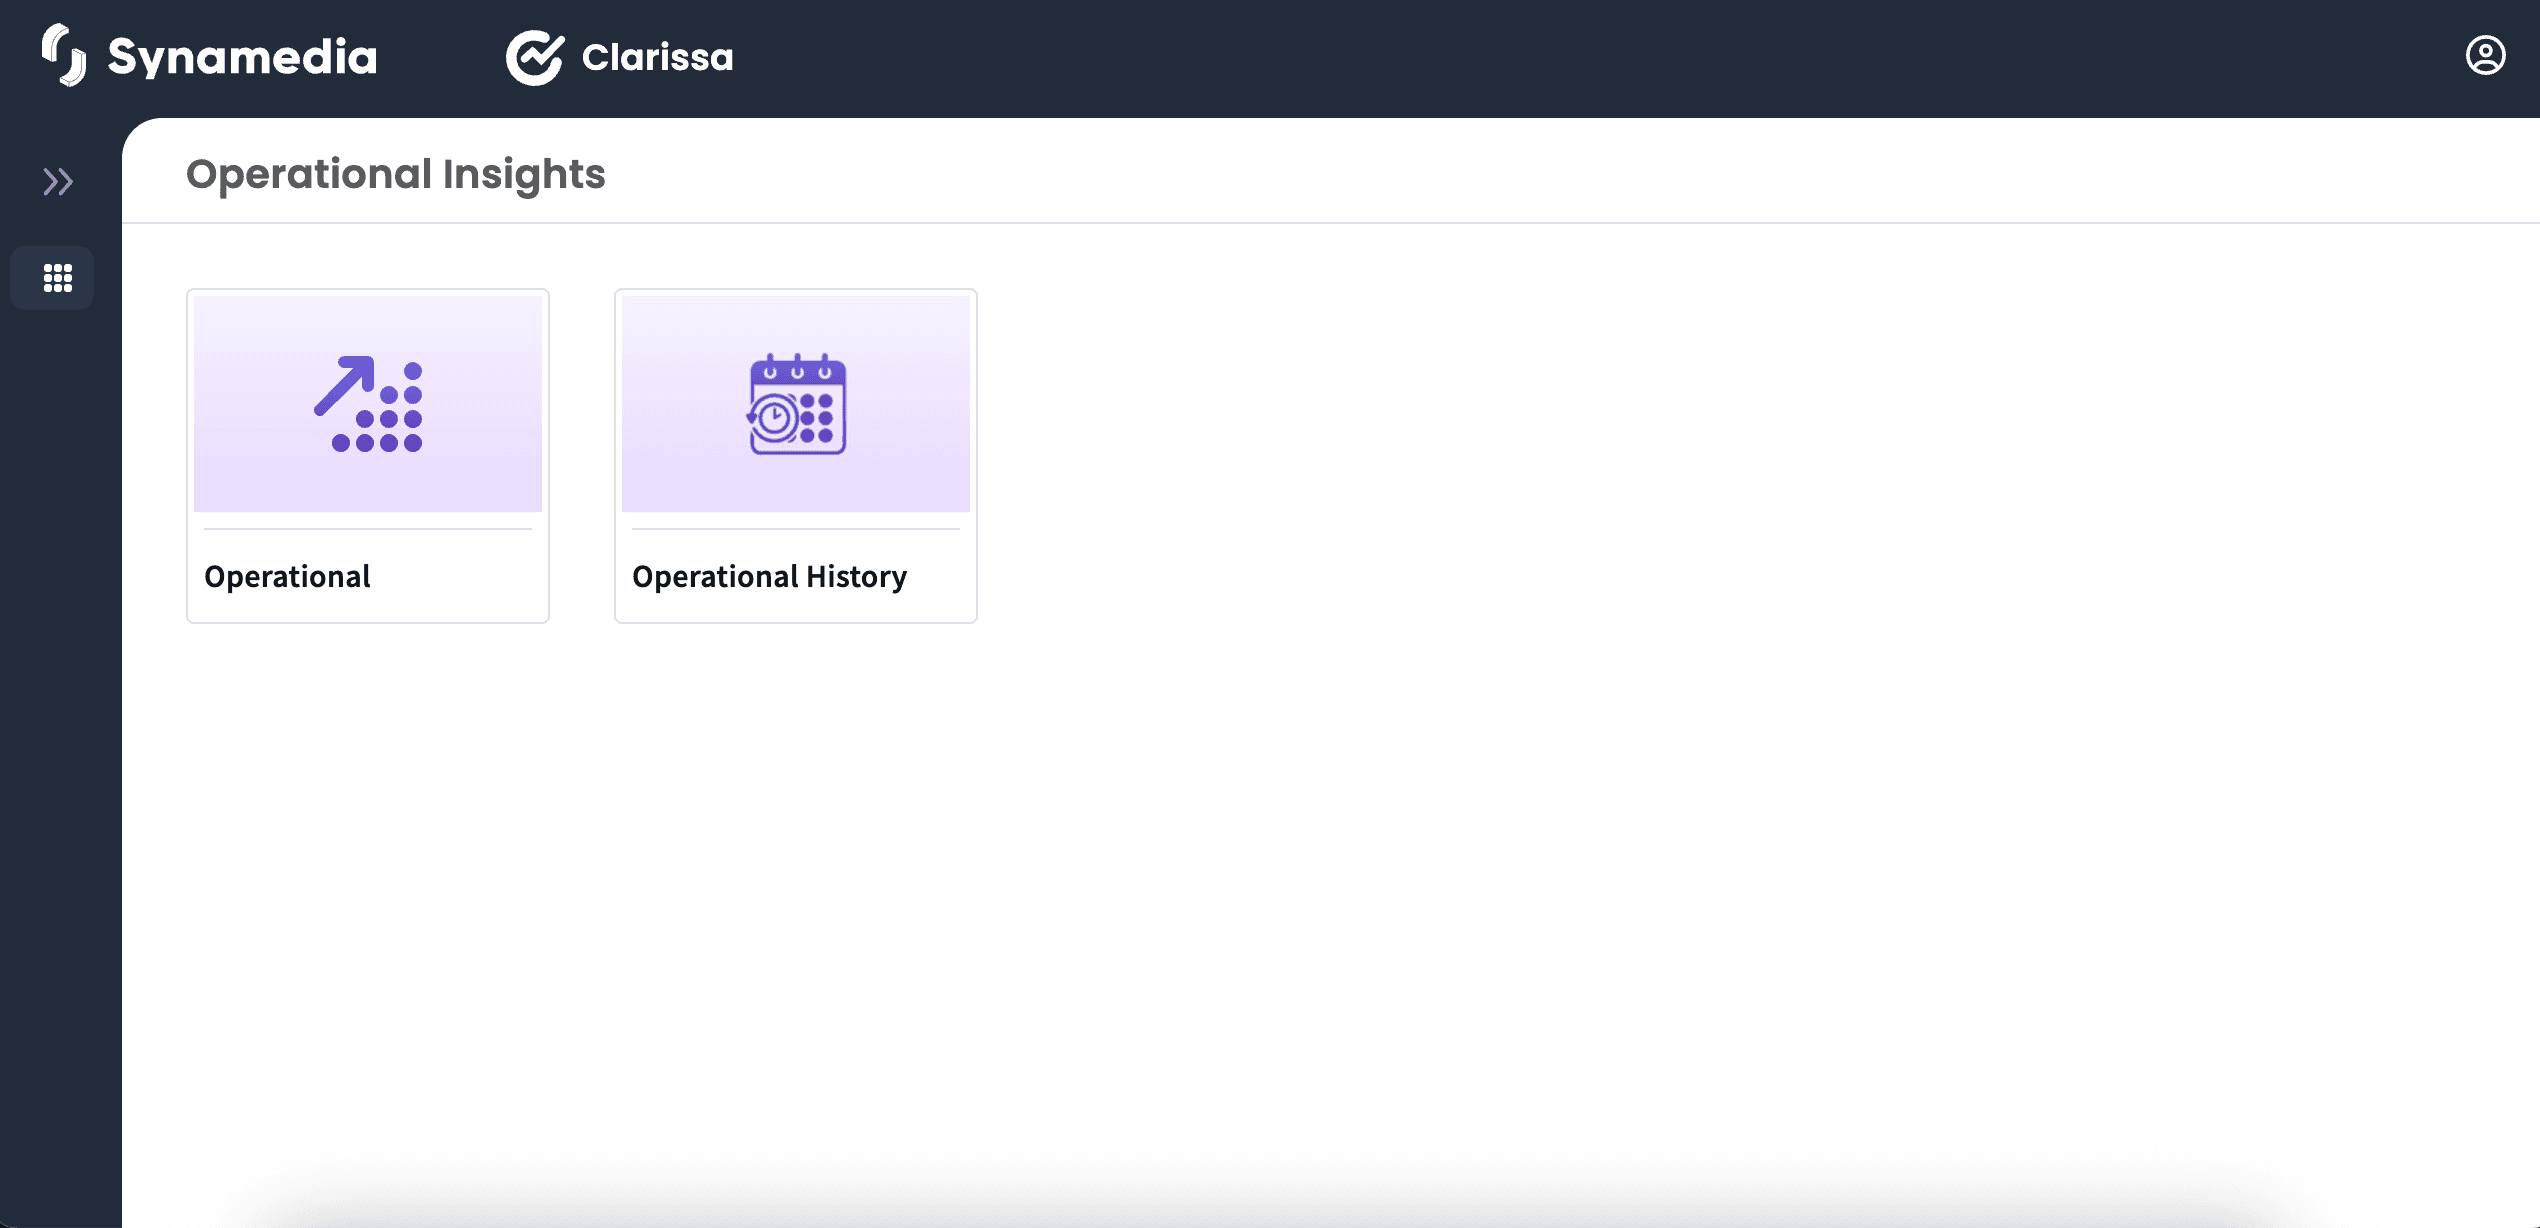
The Operational Insights dashboards comprise three sheets that focus on different analysis areas:
Startup
Playback
Capacity
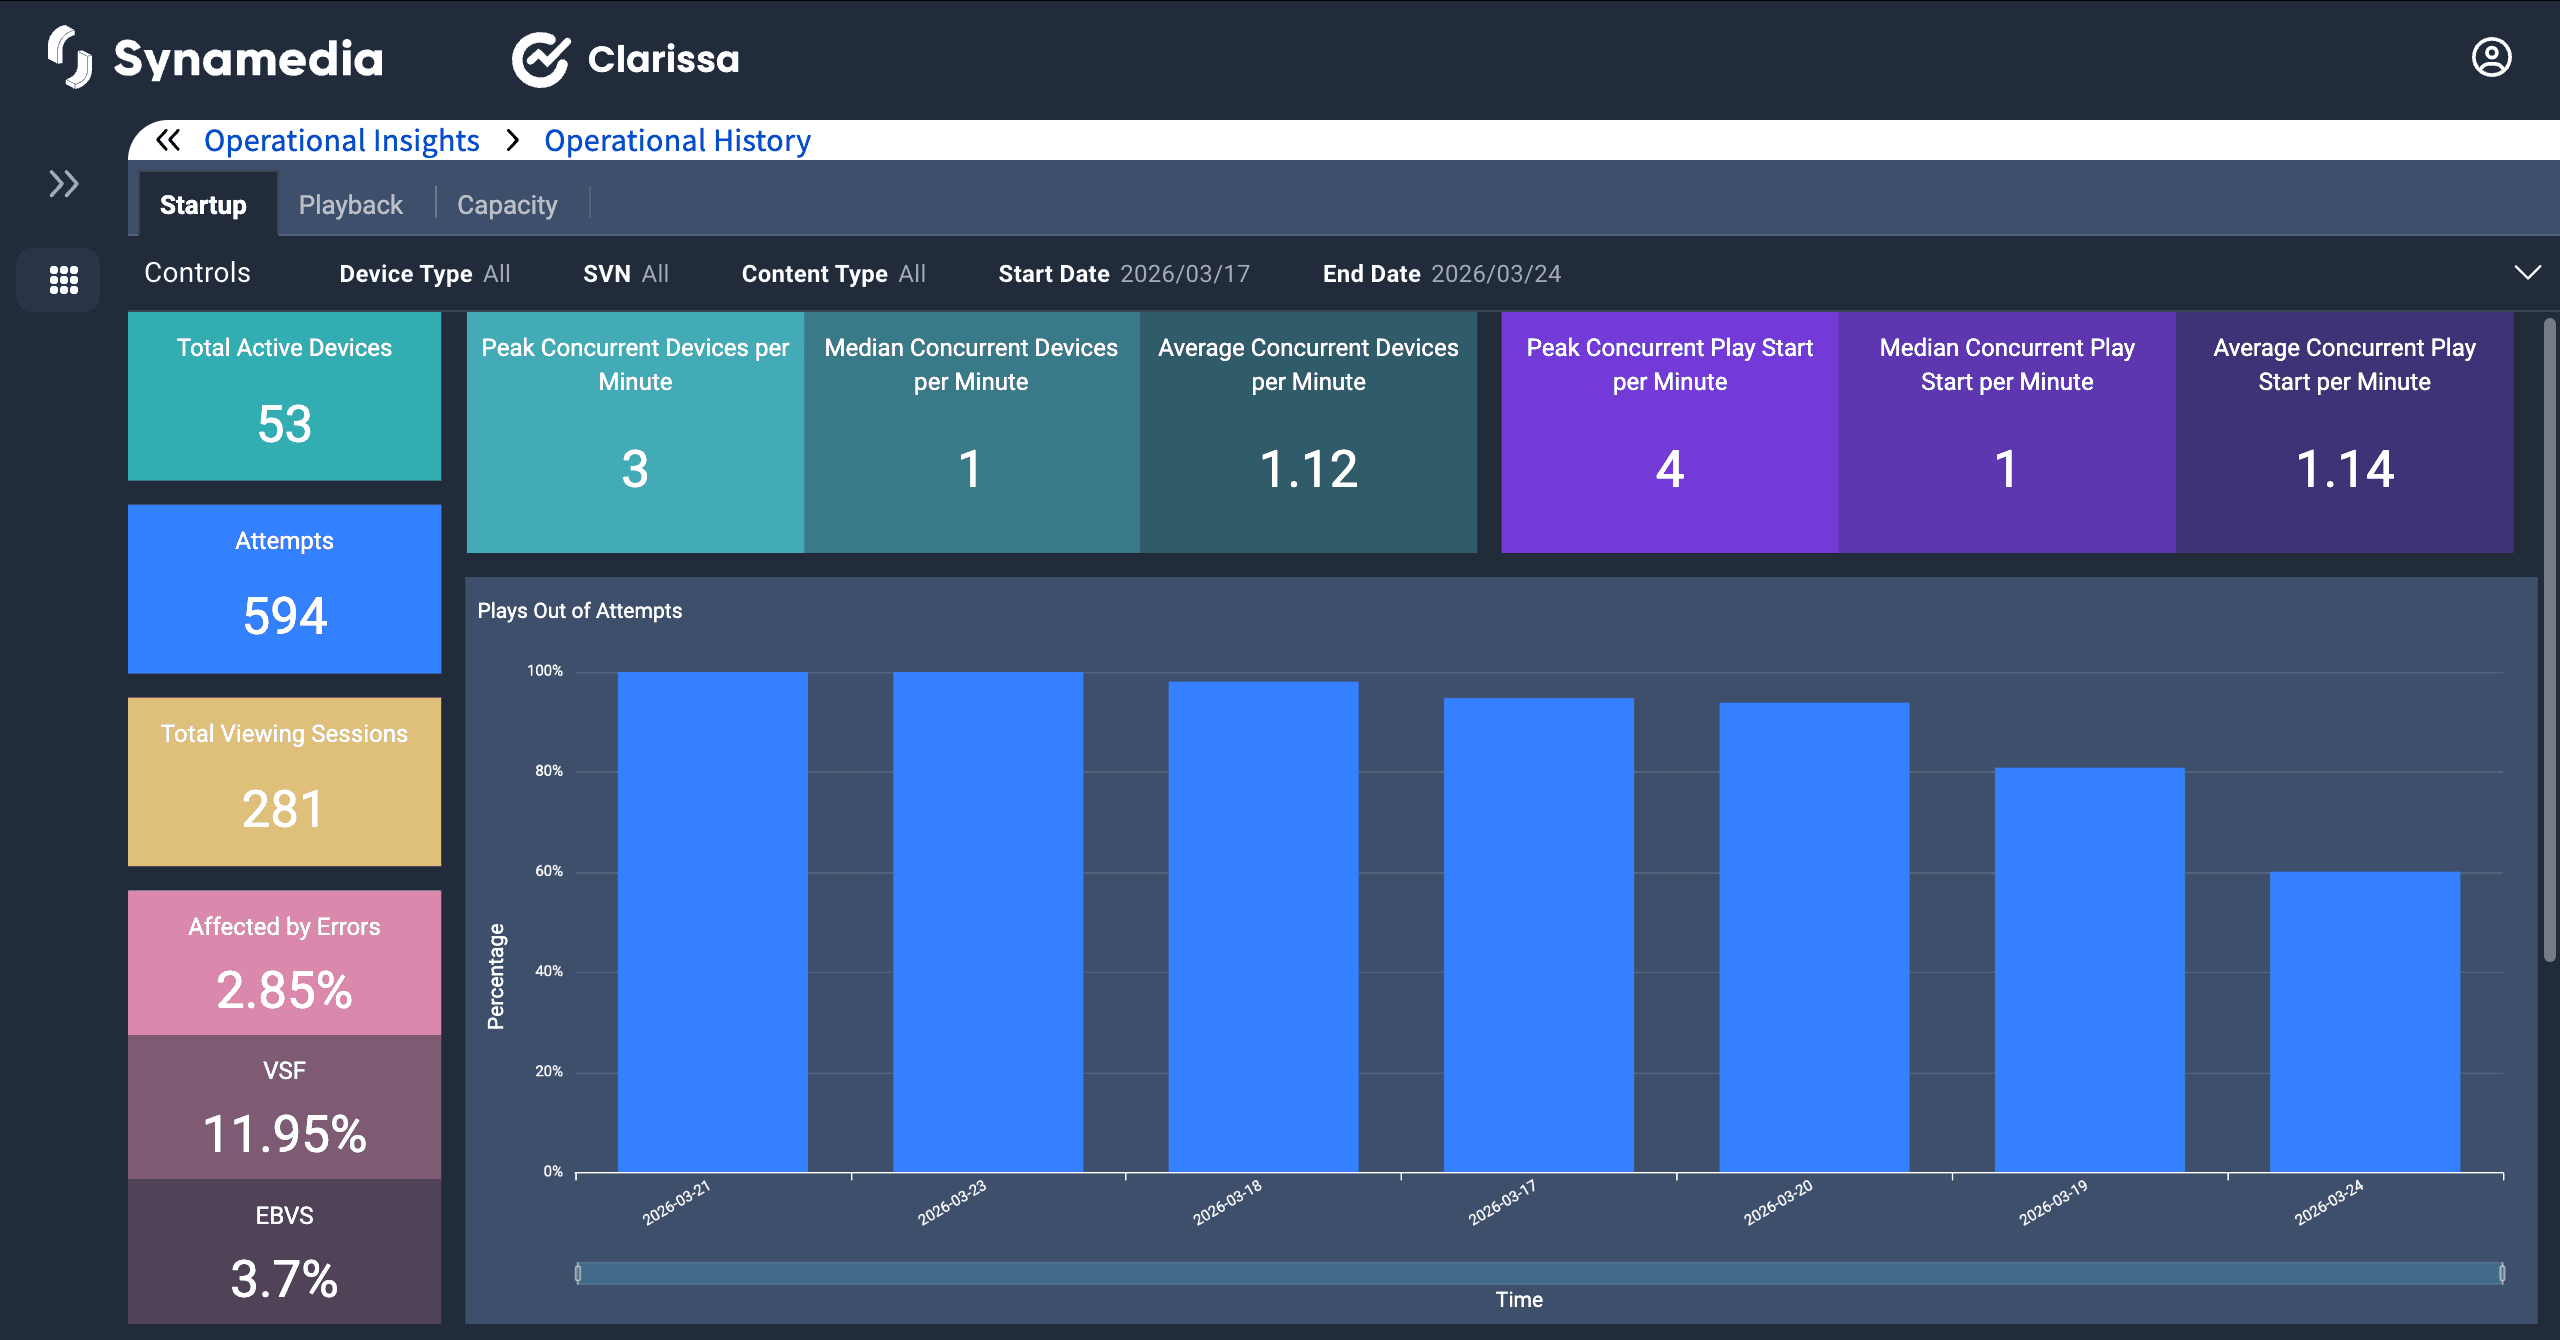
The Startup Dashboard provides a comprehensive view of service activation performance, monitoring key metrics related to device startups, session attempts, and errors. It enables operators to analyze startup success rates, concurrent device loads, and error during video start, helping to optimize service reliability and improve customer experience.
Filters at the top of the dashboard allow users to refine the data displayed.
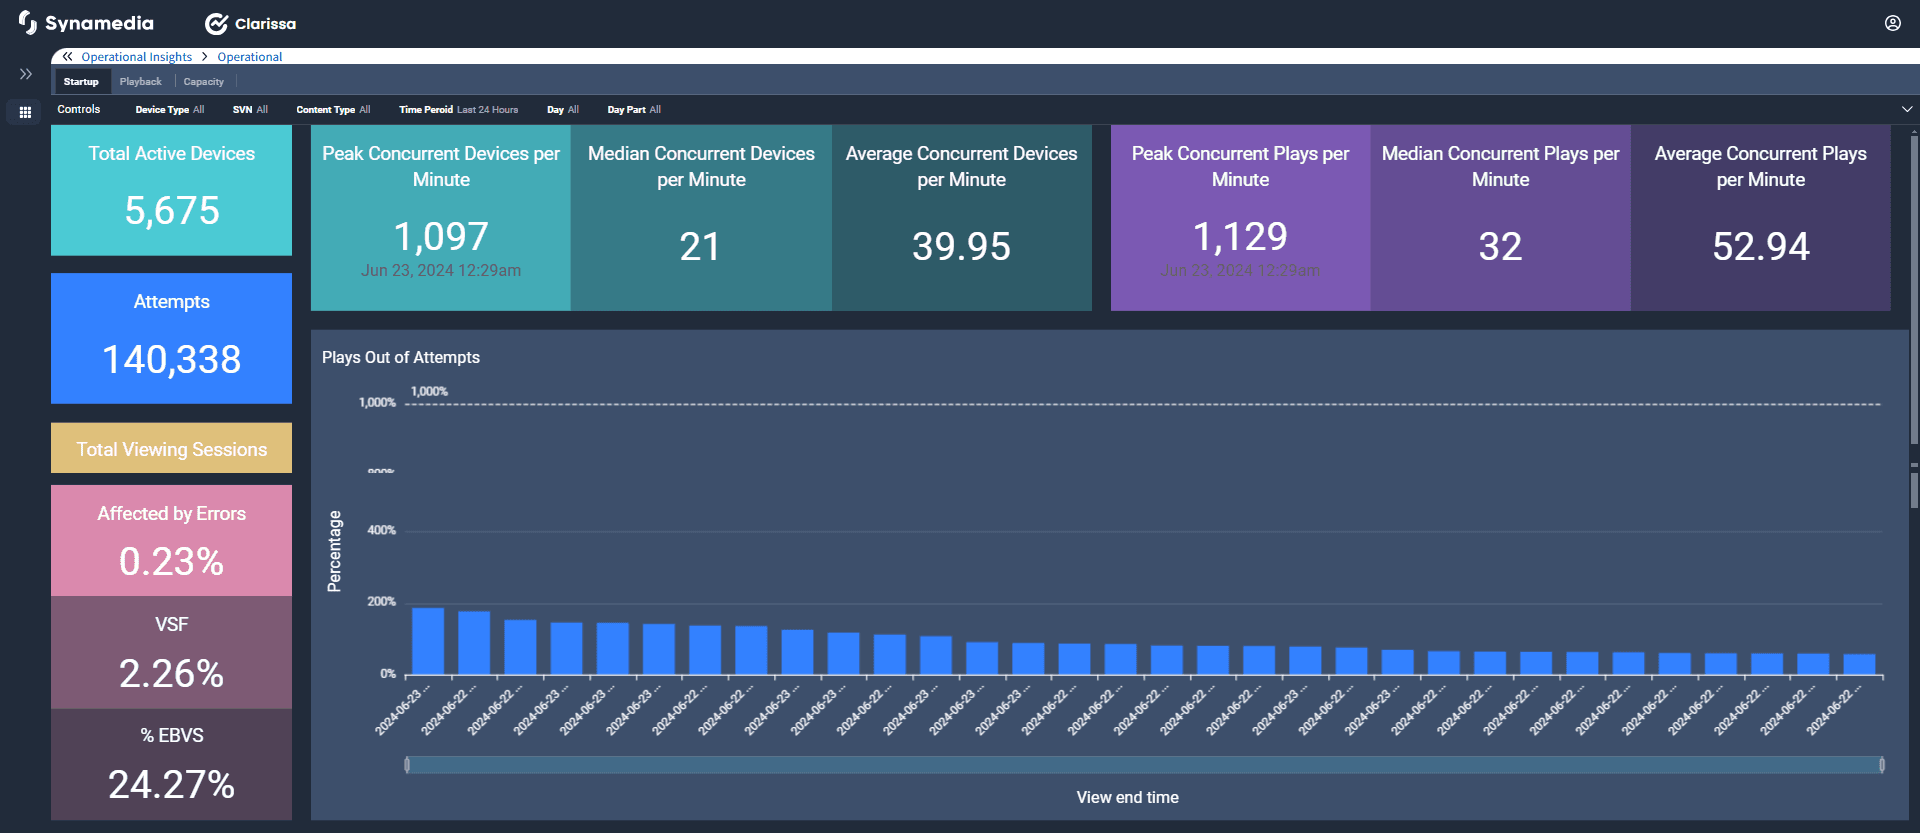
Dashboard components and metrics:
Key startup metrics: provides a quick summary of startup performance and service health. This section helps operators quickly assess startup health and identify any issues affecting service availability.
Peak & concurrent device monitoring: These metrics help in capacity planning and scaling infrastructure based on peak demand.
Plays out of attempts (Bar Chart): A visual representation of play success rates out of the total startup attempts over time. Helps operators identify periods with lower success rates and investigate causes (e.g., network congestion, authentication failures).
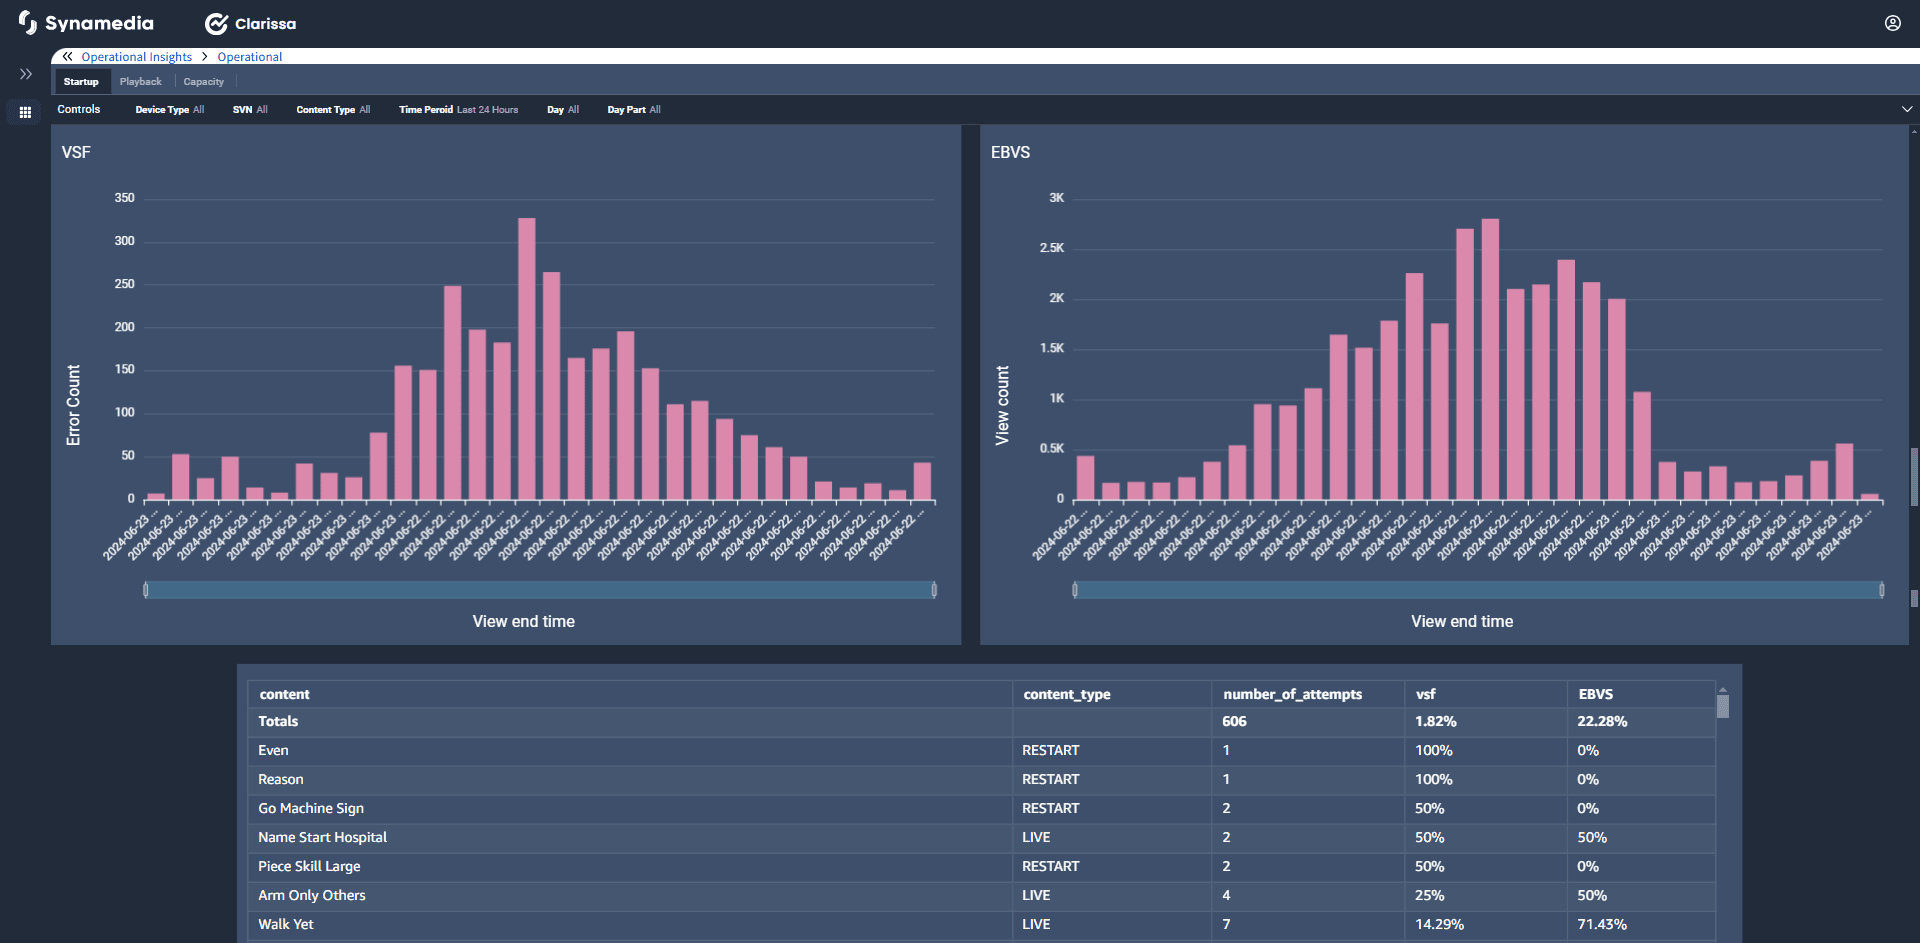
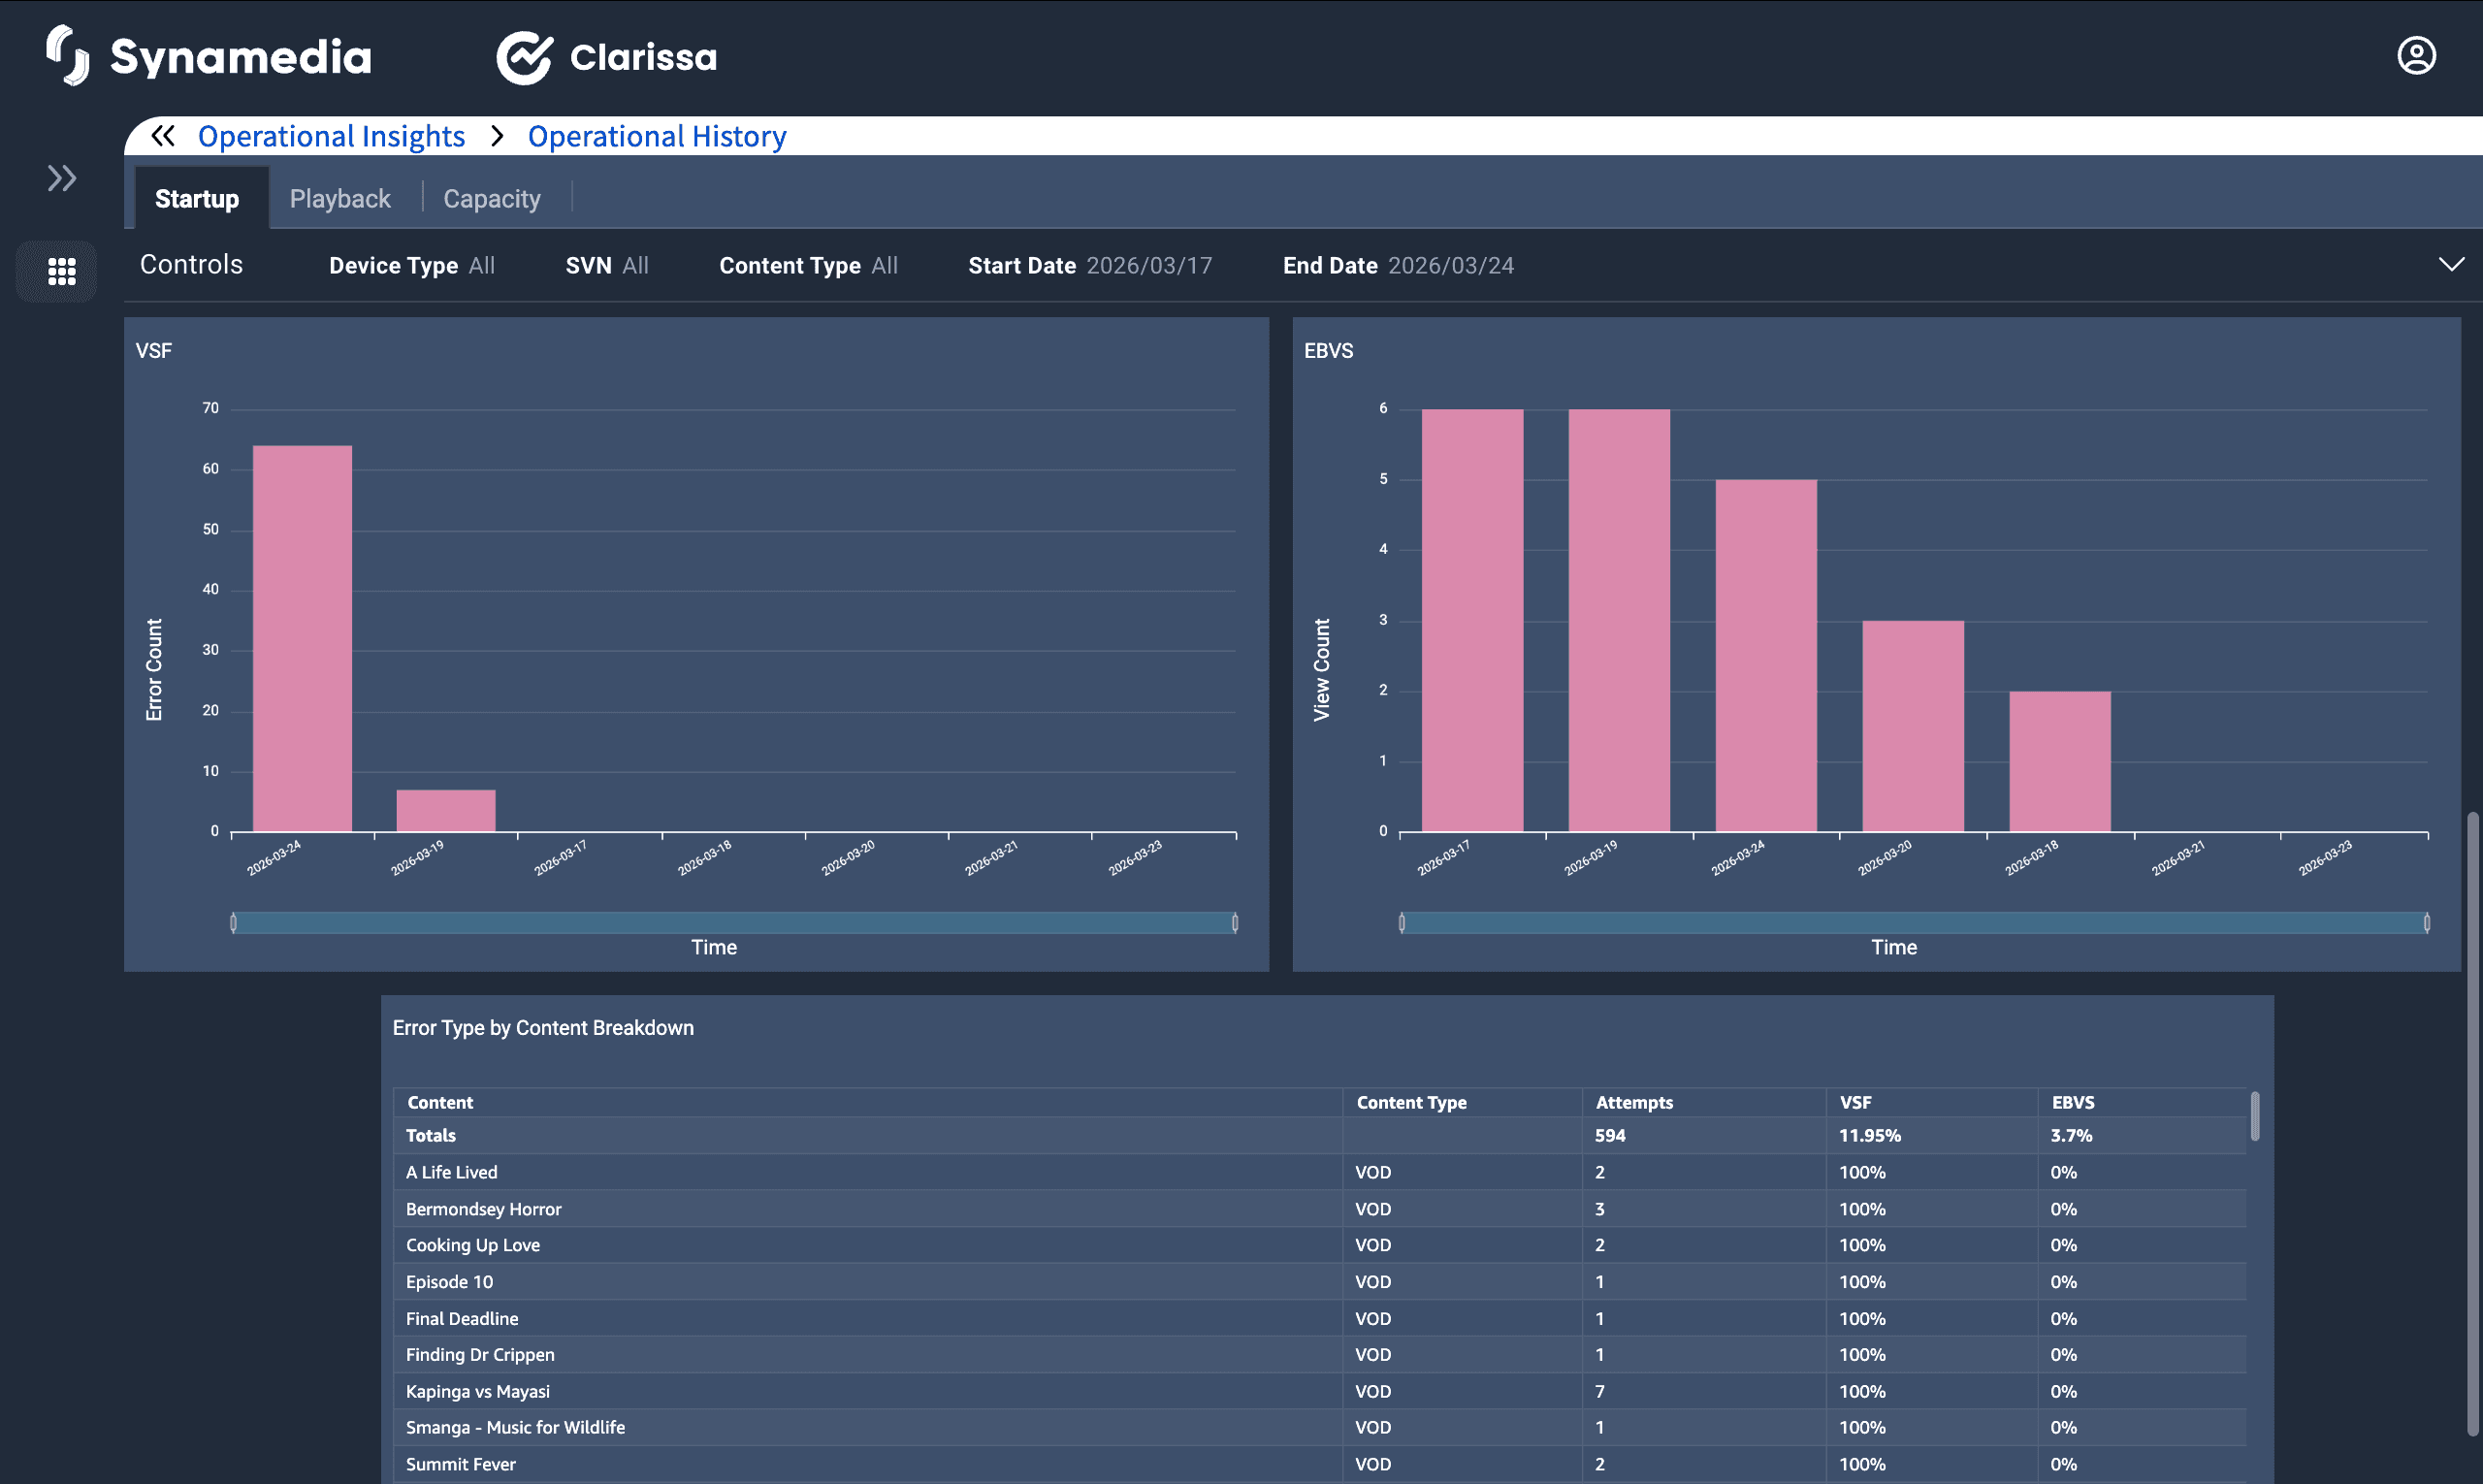
Error breakdown – VSF & EBVS (Graph View): The VSF (View Start Failures) and EBVS (Errors Before Video Start) graphs visualize error trends over time. Helps diagnose patterns of startup failures and resolve bottlenecks proactively.
Error type & content breakdown (Table View): A detailed error analysis with breakdowns by content type and reasons for startup failures. This table helps operators identify which content types face higher failure rates and optimize delivery strategies accordingly.
The Startup Dashboard provides critical insights that allow operators to:
Optimize startup success rates by identifying failure trends.
Improve service reliability by reducing VSF and EBVS percentages.
Ensure scalability by monitoring peak concurrent device loads.
Detect problematic content or device types with higher failure rates.
By leveraging these insights, operators can enhance customer experience, reduce churn, and optimize content delivery infrastructure.
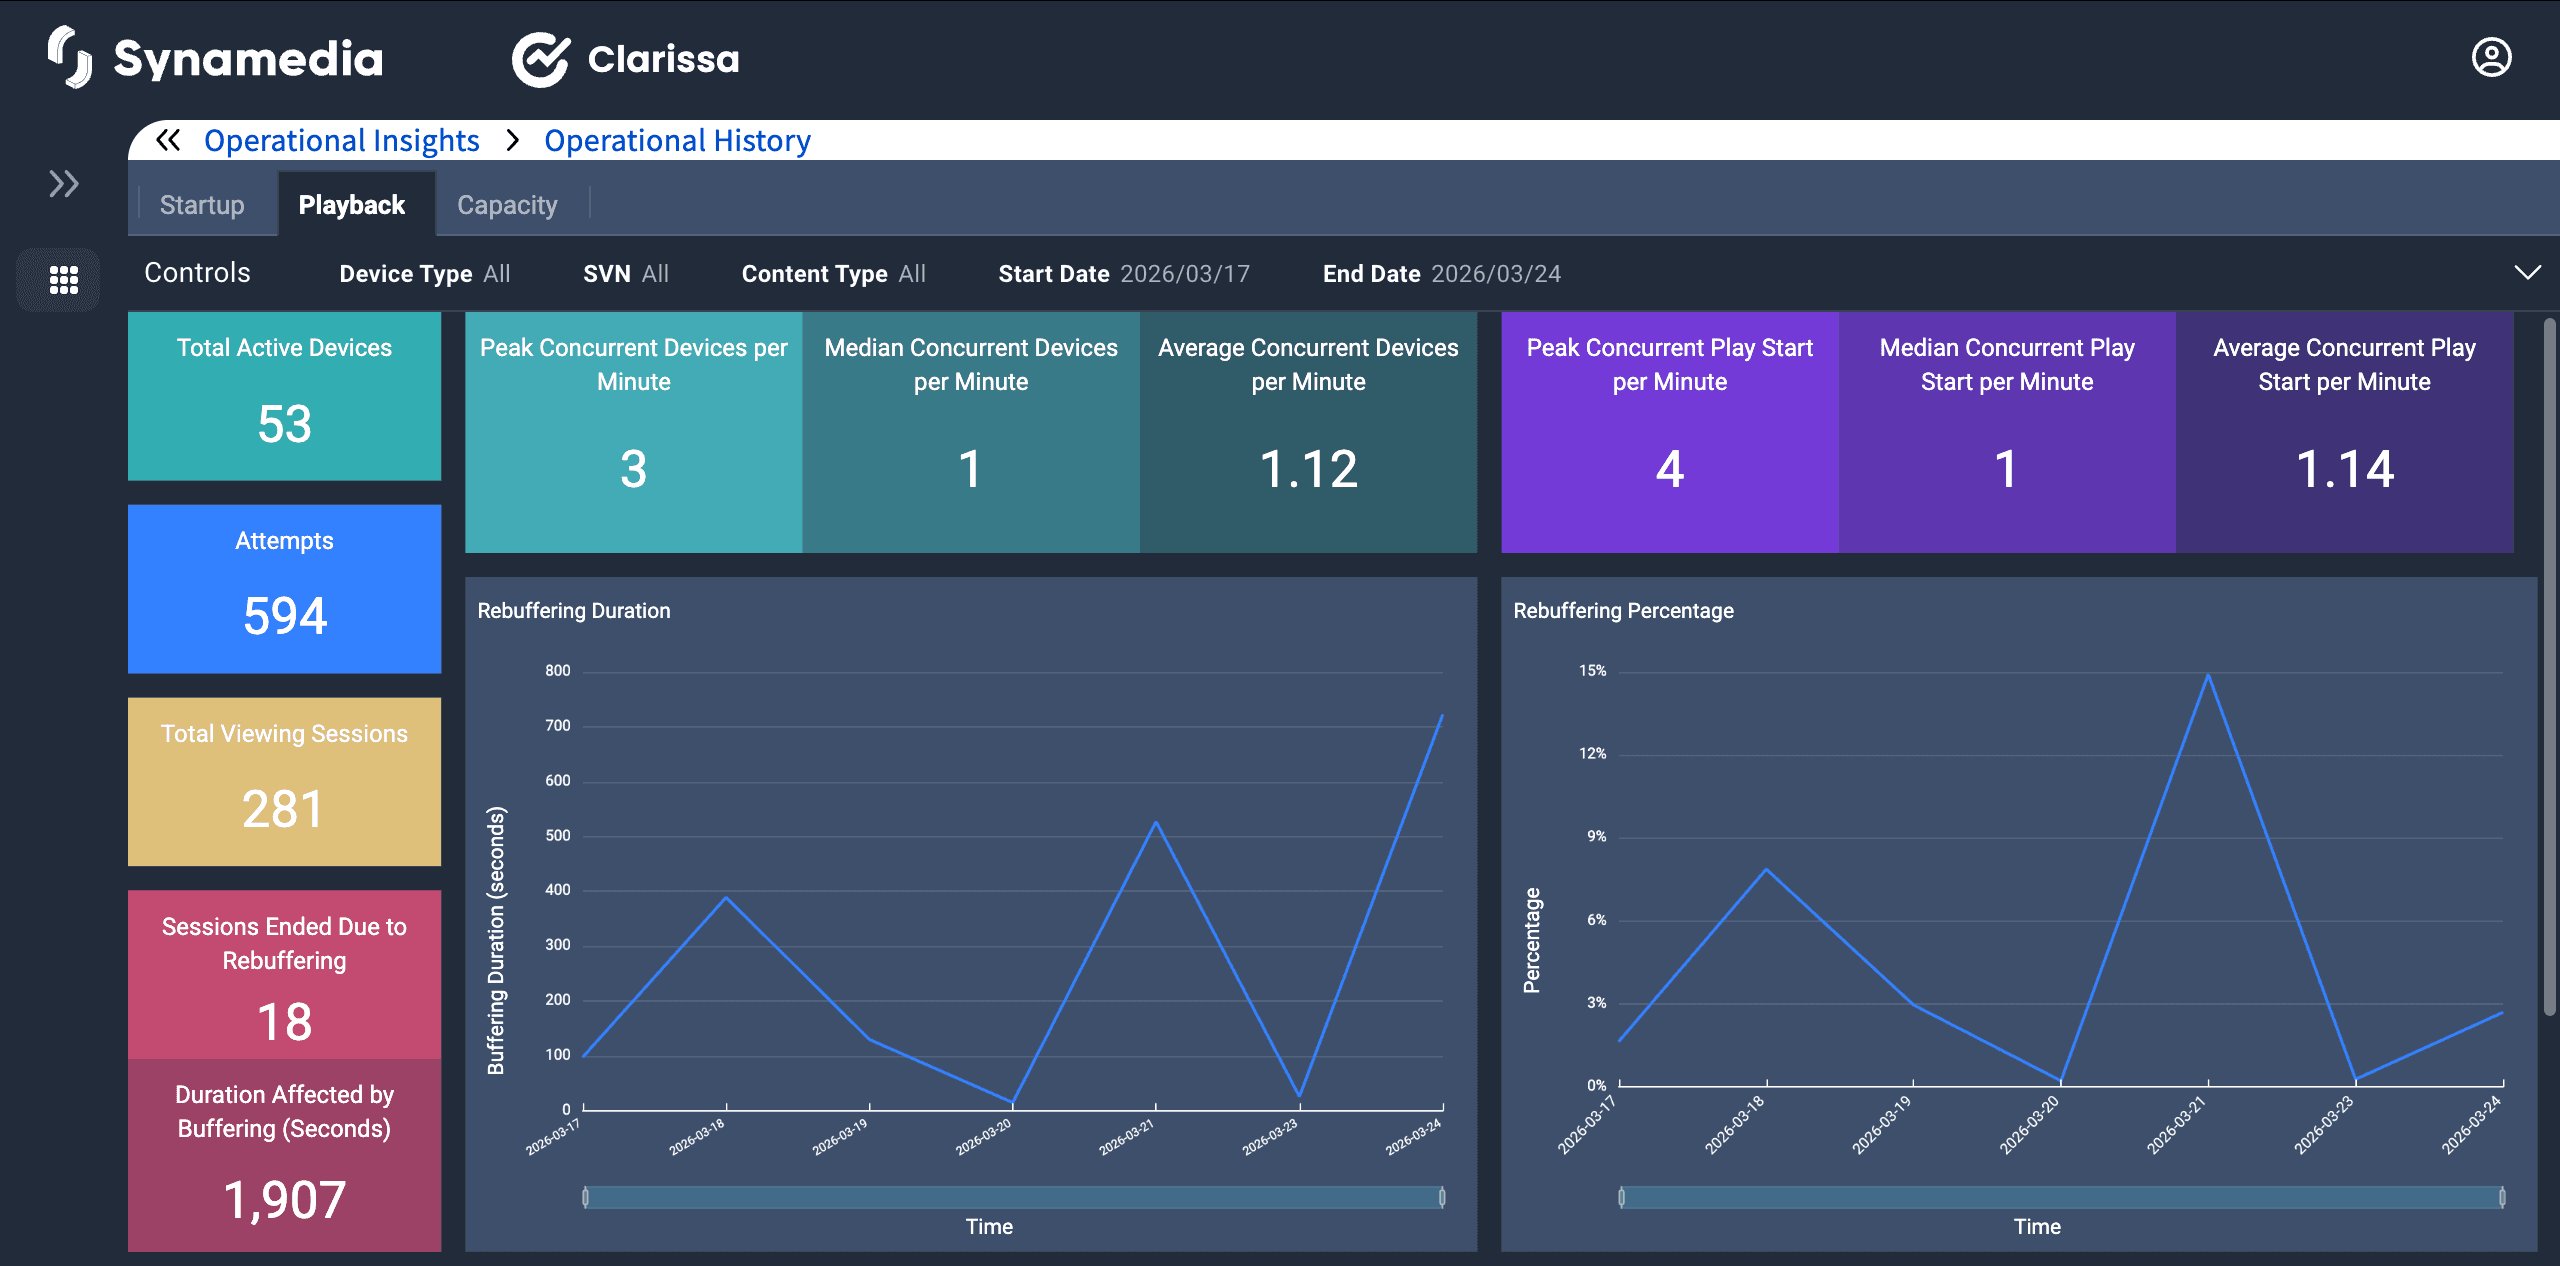
The Playback Dashboard provides a detailed analysis of video playback performance, focusing on key metrics related to buffering, playback errors, and video quality. It enables operators to monitor user experience, identify performance bottlenecks, and proactively optimize content delivery to ensure a seamless viewing experience.
Filters at the top of the dashboard allow users to refine the data displayed.
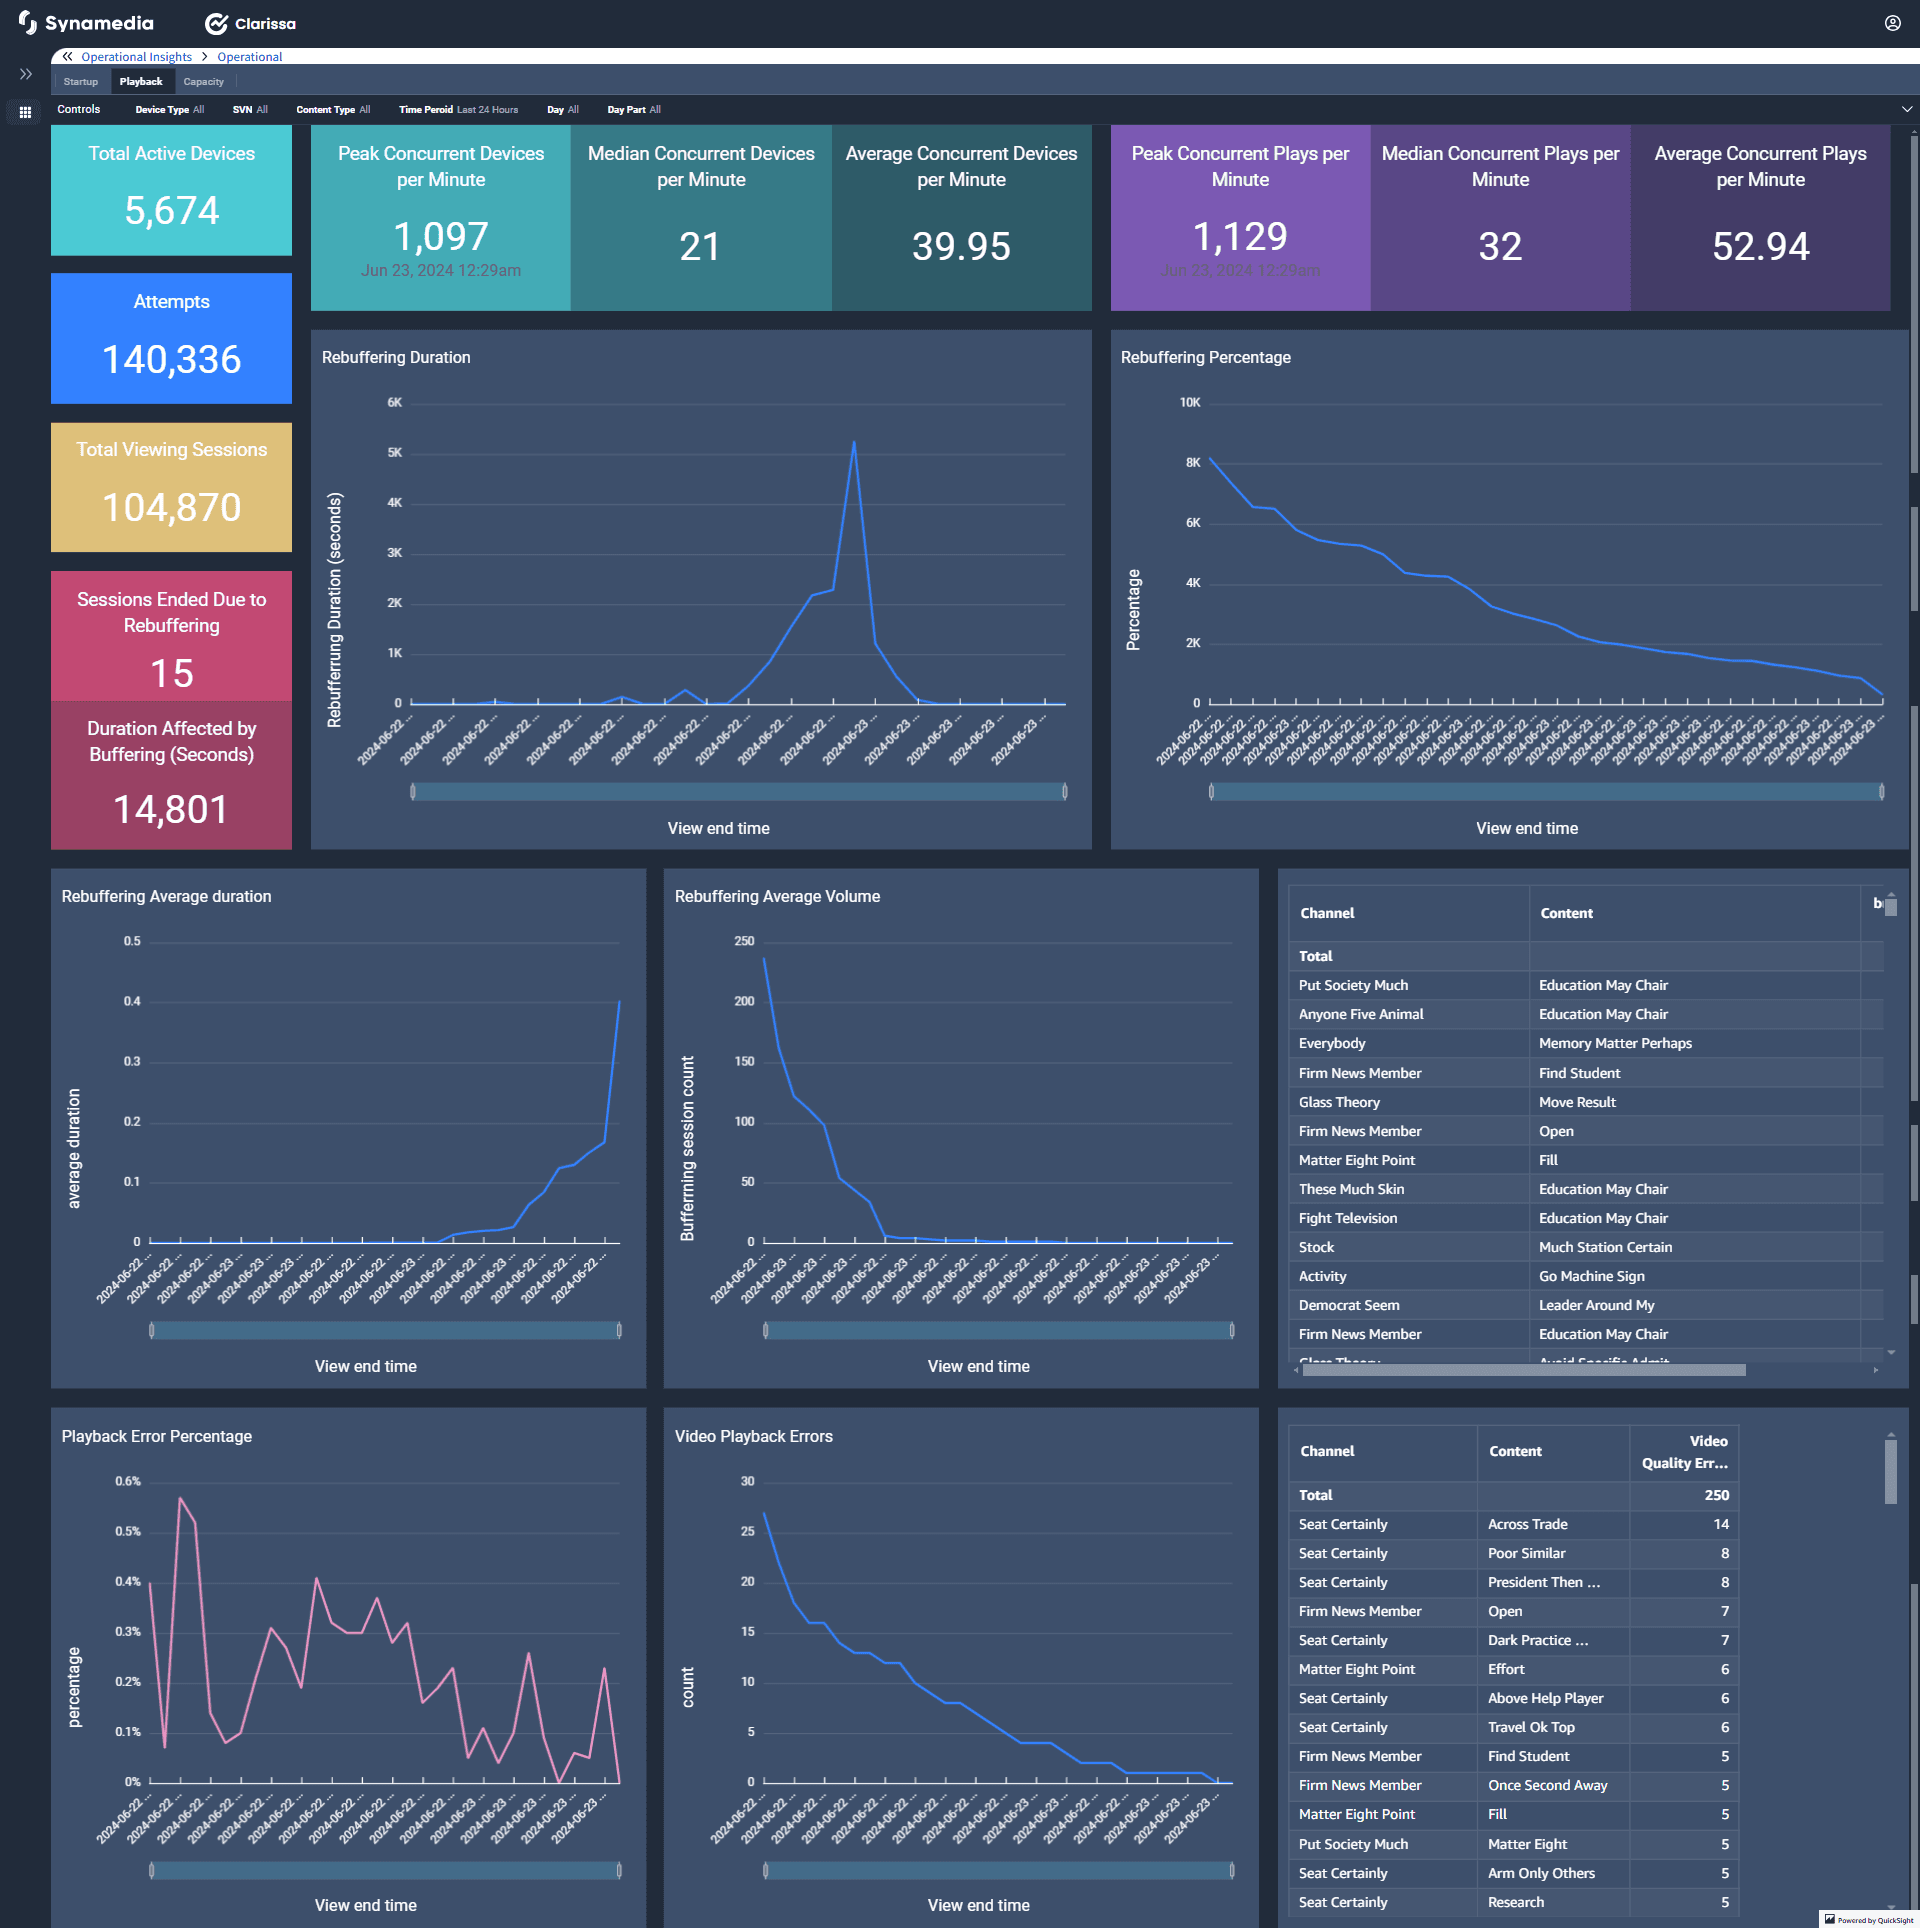
Dasboard components and metrics:
Key playback performance metrics: This section provides a high-level summary of playback performance and user experience metrics. It helps operators quickly assess playback health and detect issues affecting the user experience.
Rebuffering analysis (Graphs & Charts): Rebuffering impacts user experience and engagement. This section provides insights into buffering duration, frequency, and affected content.
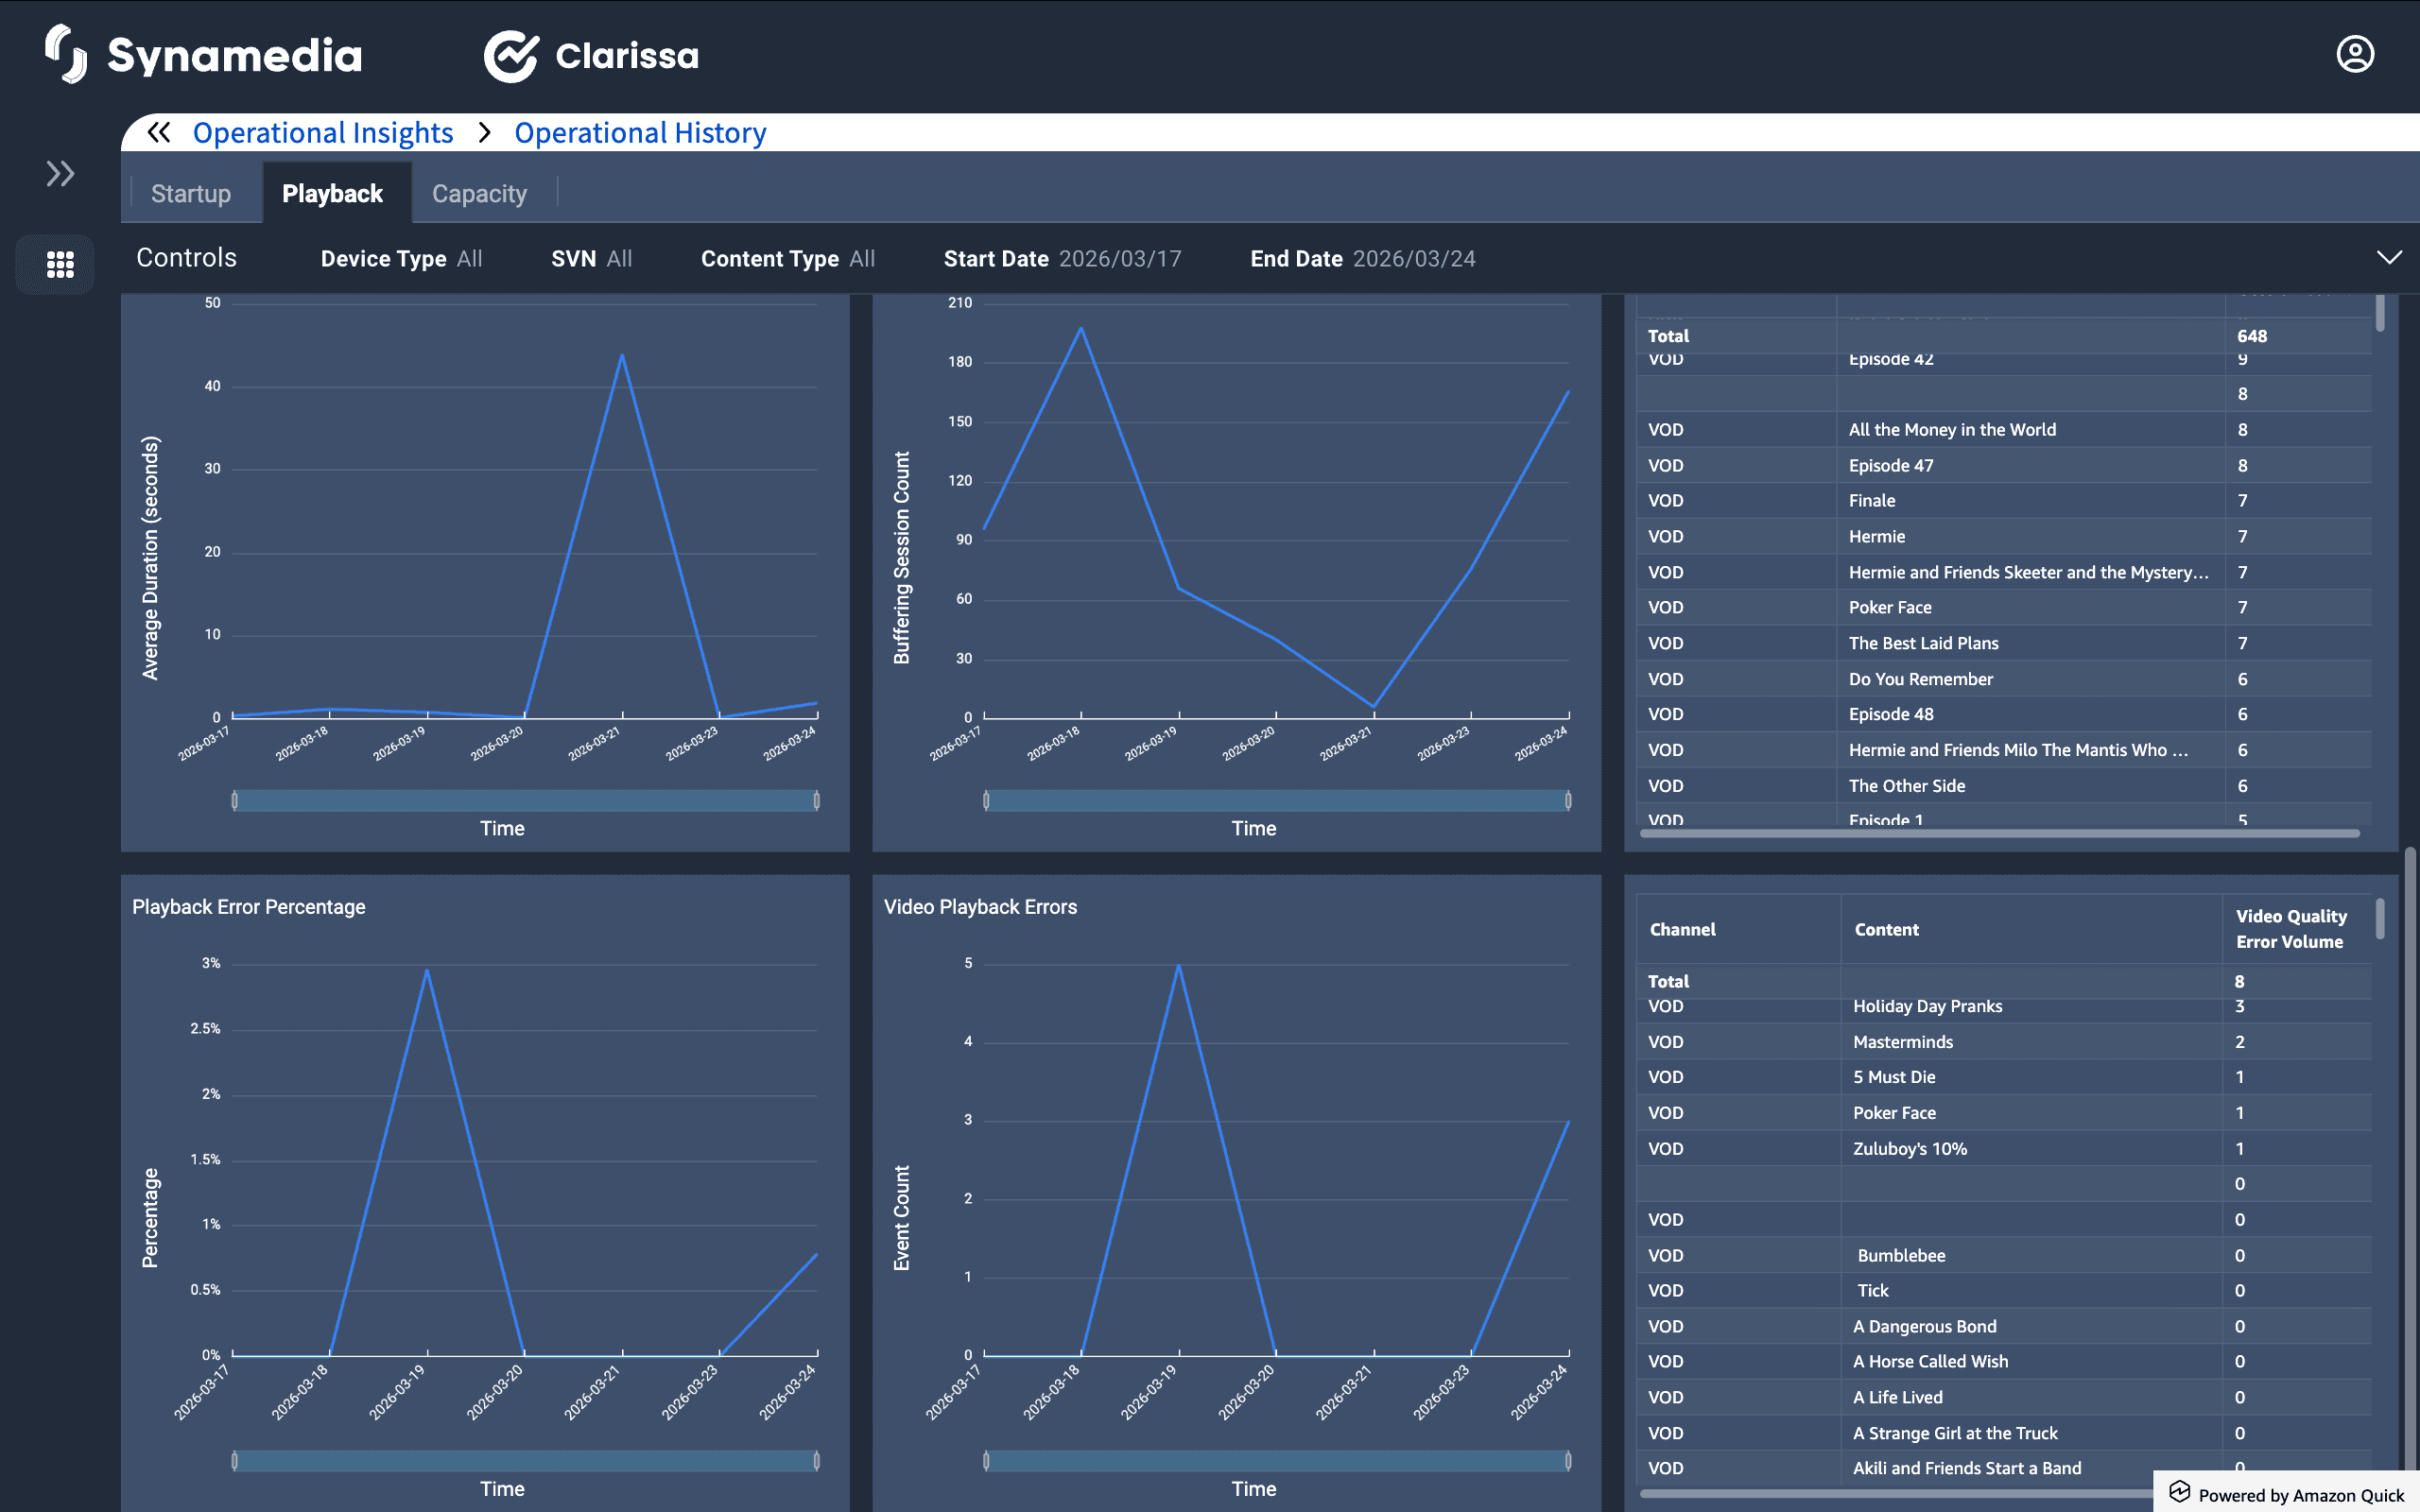
Playback errors & video quality analysis: Helps identify error patterns and optimize content delivery. Assists in troubleshooting video player issues, DRM errors, or content delivery failures.
Content & channel analysis: Helps operators prioritize fixes for high-impact content that has frequent playback failures. Enables content providers to optimize encoding settings for a better viewing experience.
The Playback Dashboard provides critical insights that allow operators to:
Reduce buffering and improve playback quality.
Identify and resolve video errors before they impact users.
Optimize content delivery for different device types.
Ensure seamless video experiences, reducing user churn.
By leveraging these insights, operators can proactively improve content performance and maximize viewer satisfaction.
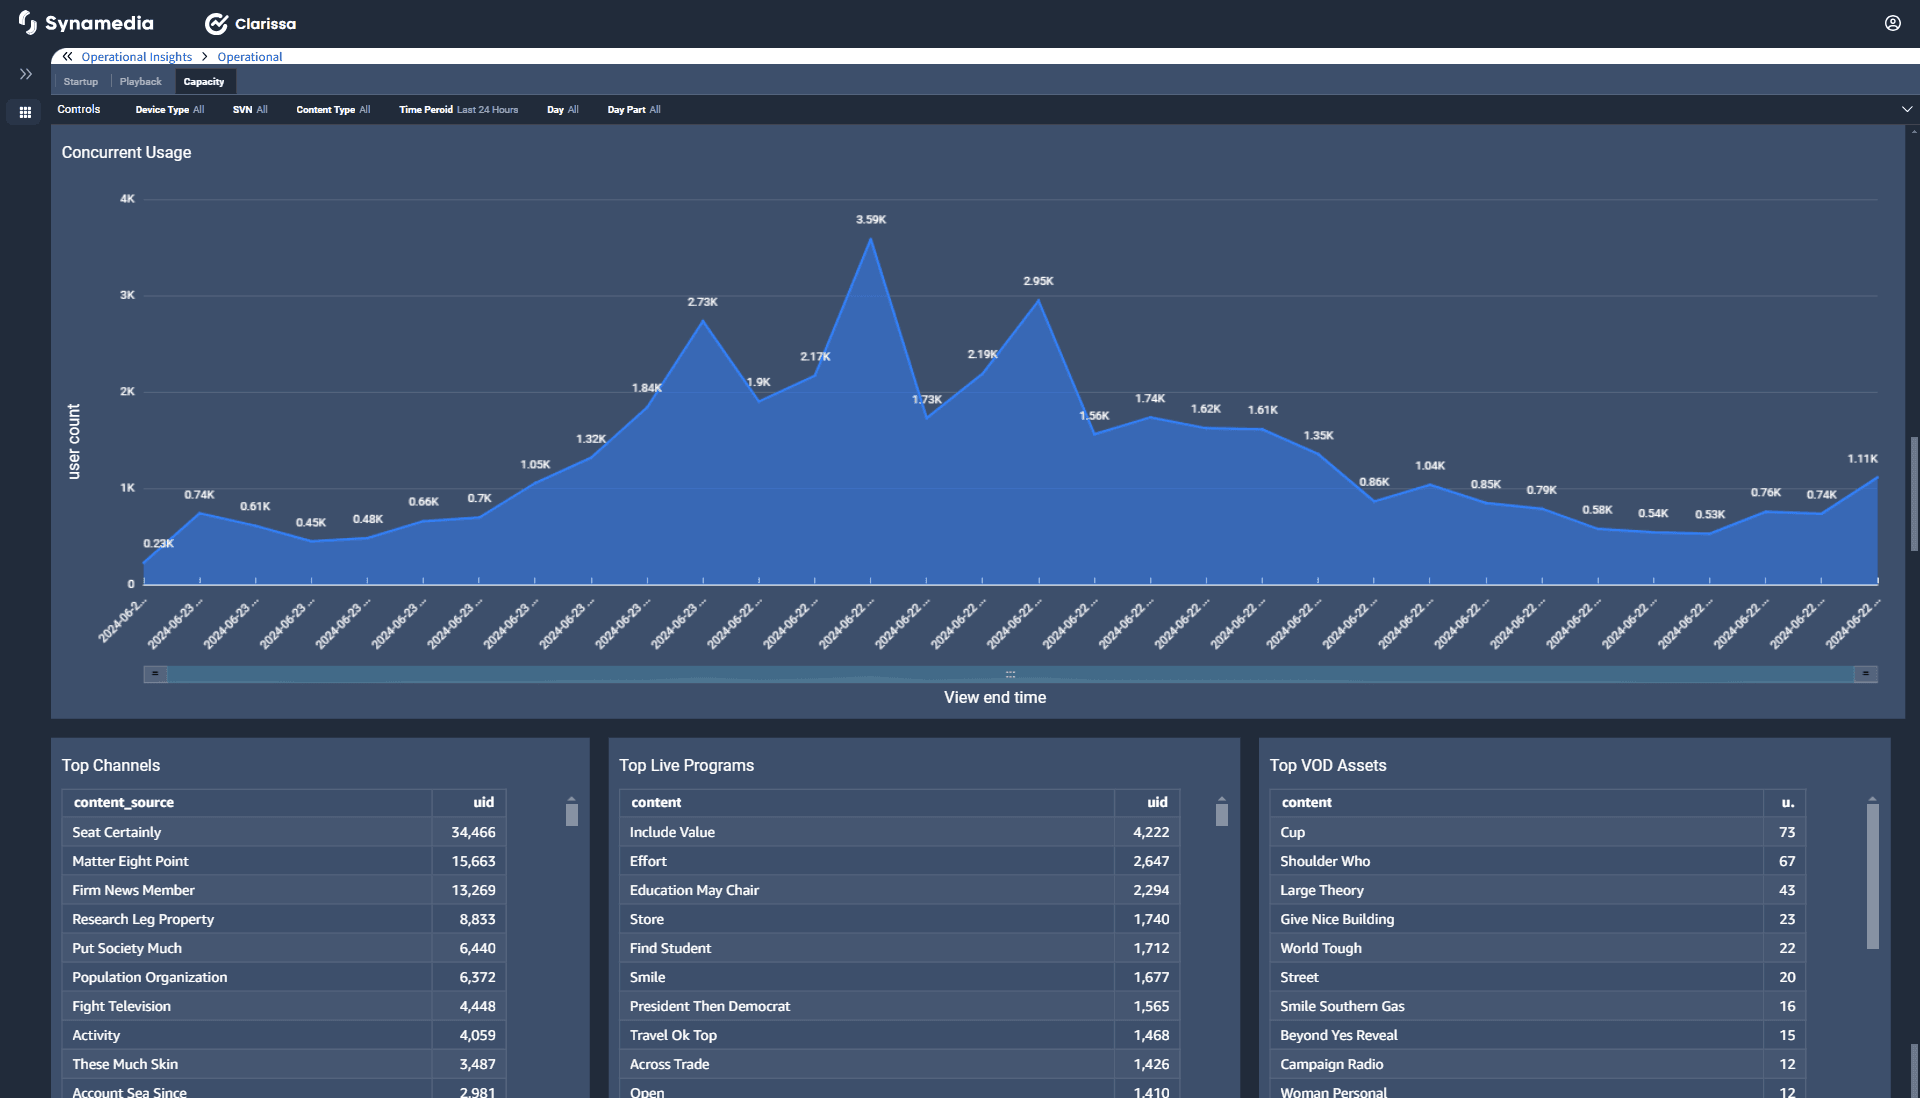
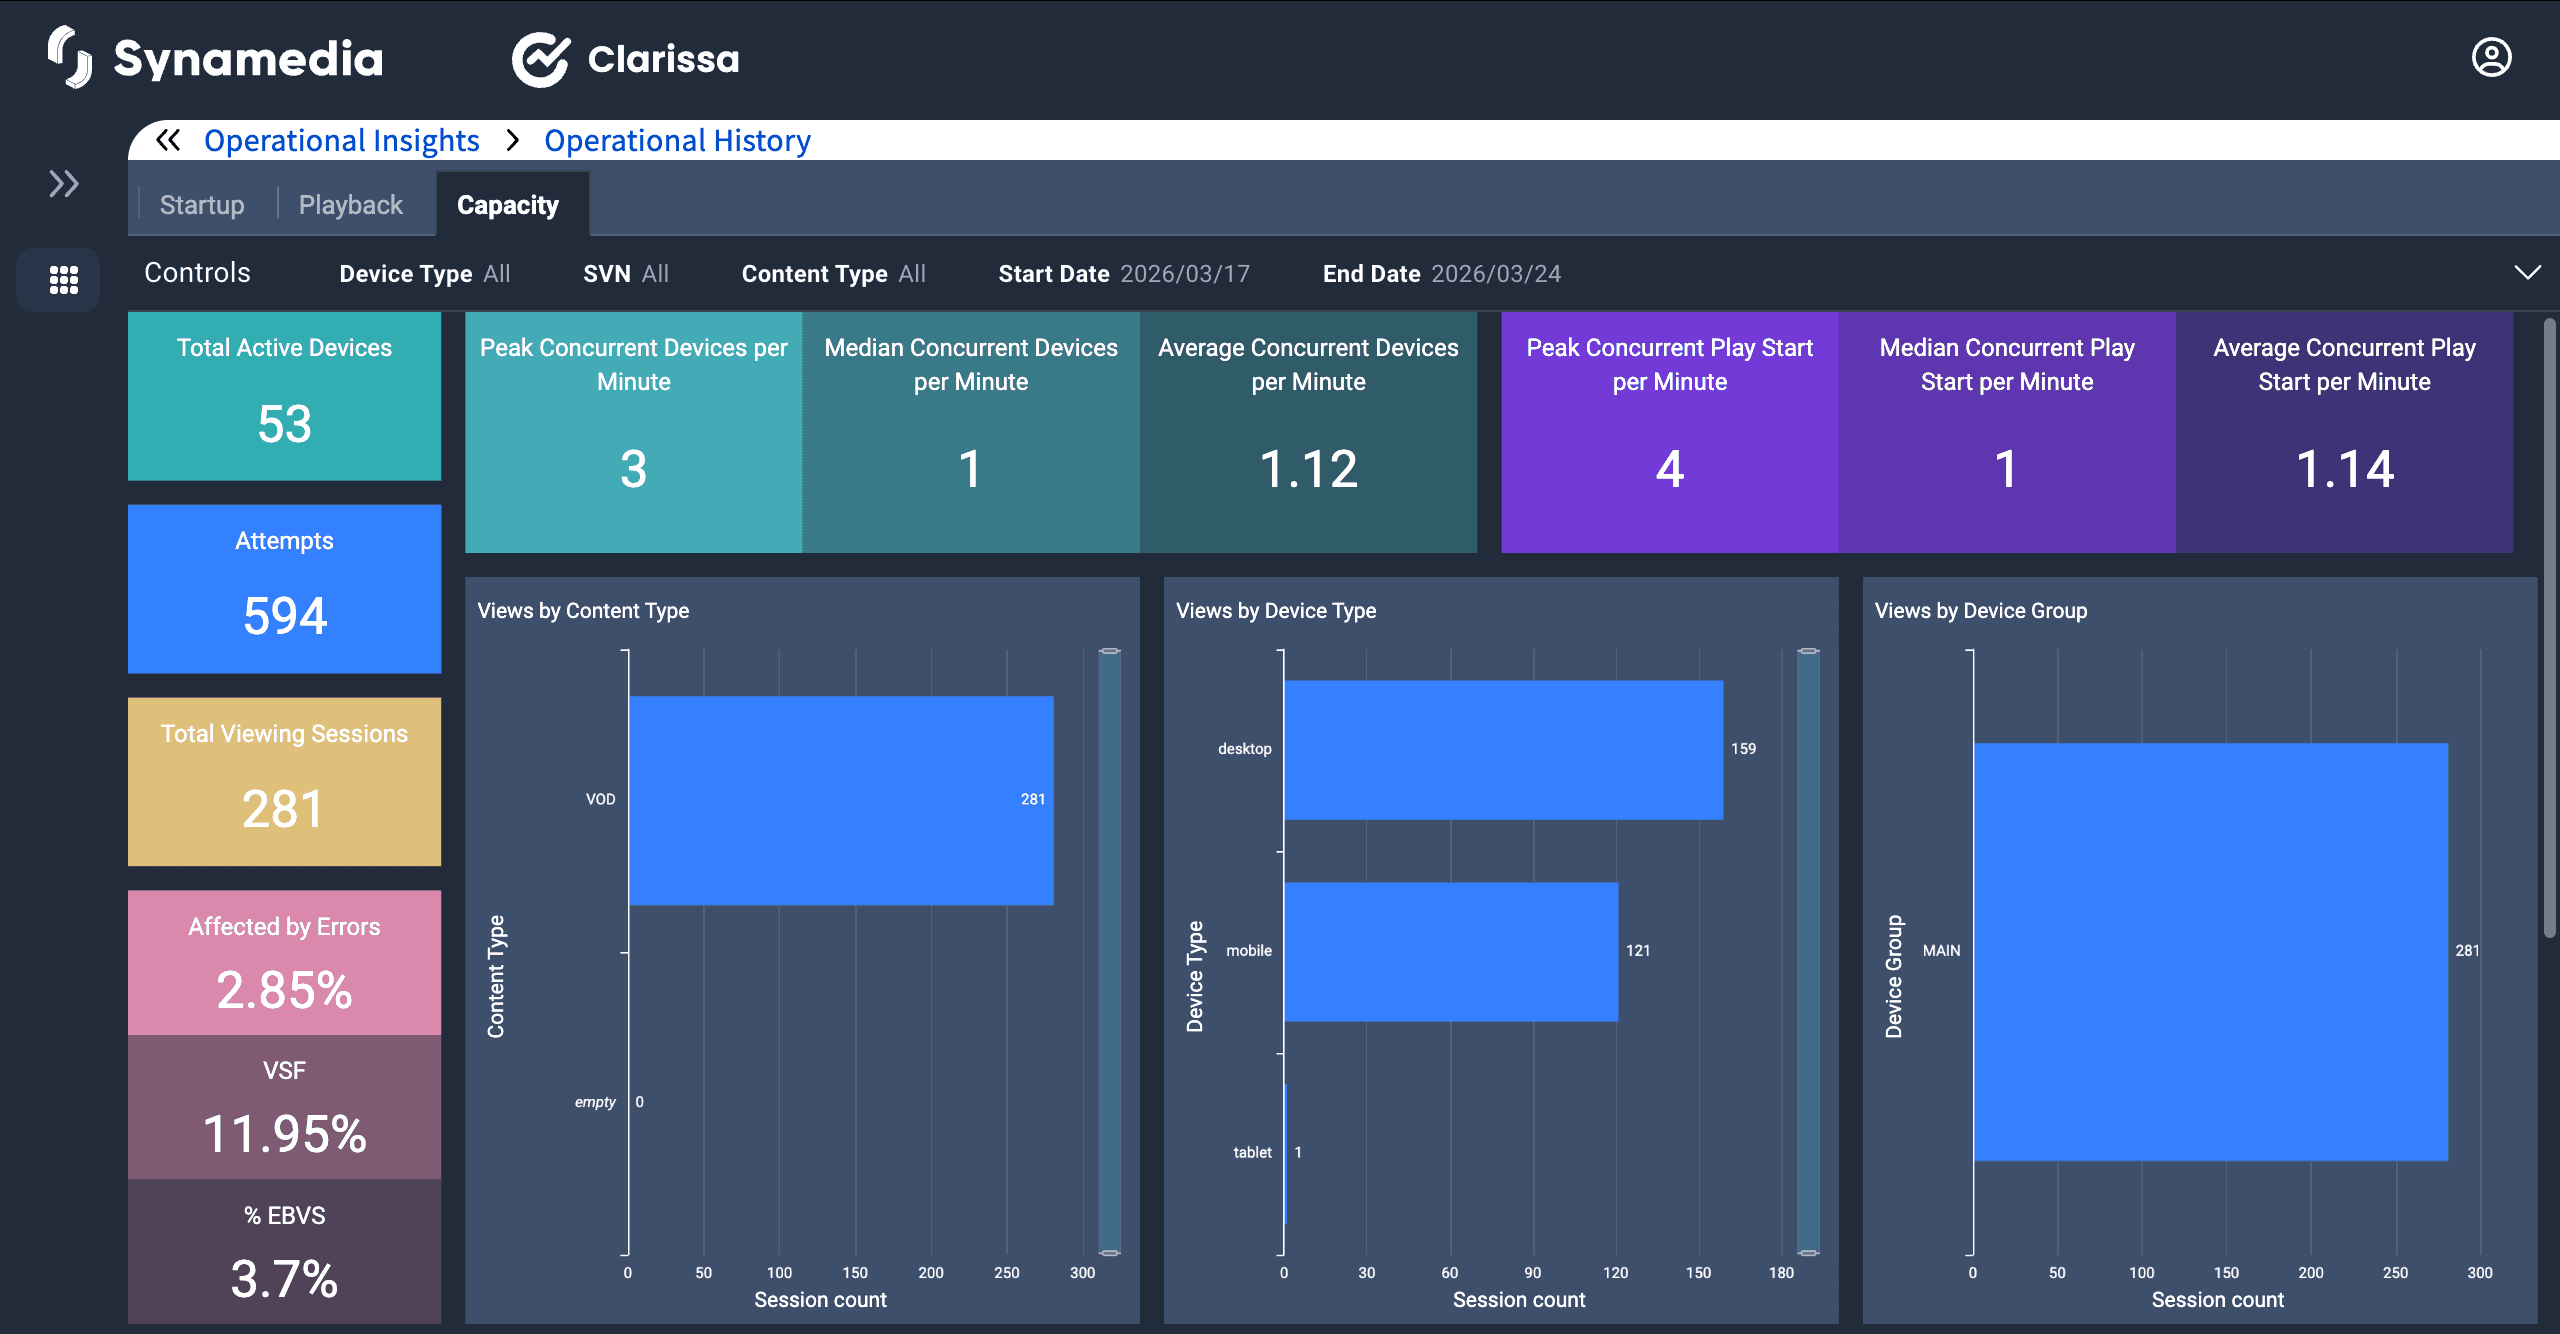
The Capacity Dashboard provides a real-time view of system load, concurrent device activity, and content consumption trends. This dashboard helps operators monitor infrastructure performance, track peak usage patterns, and optimize service capacity to ensure seamless content delivery.
Filters at the top of the dashboard allow users to refine the data displayed.
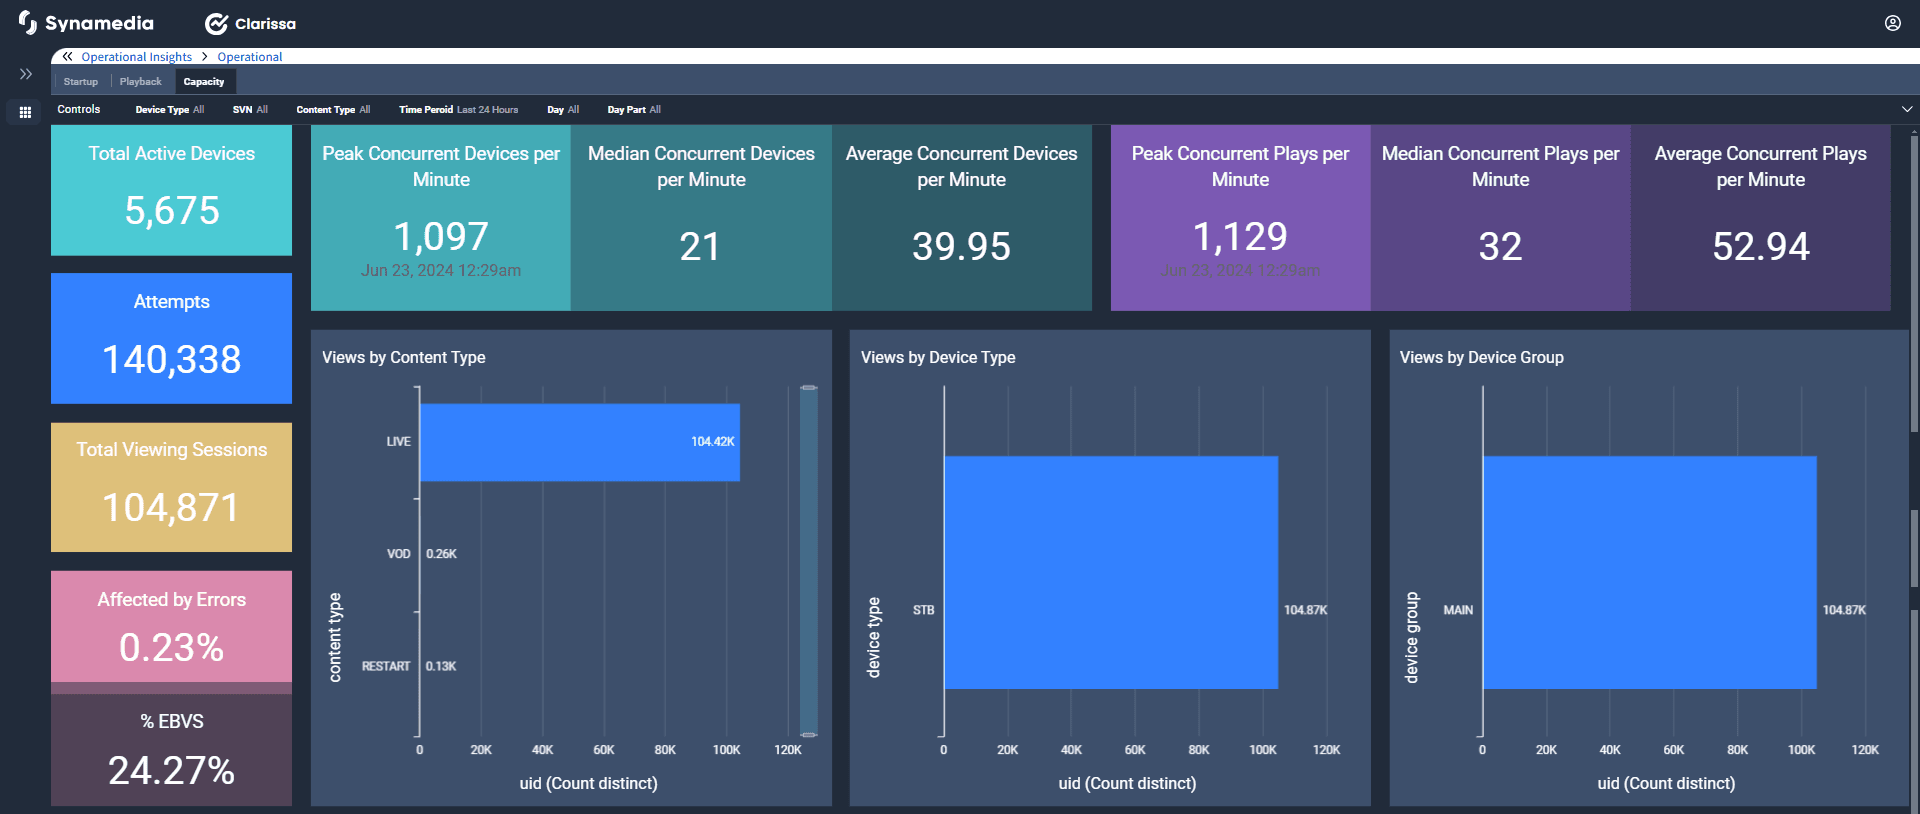
Dasboard components and metrics:
Key capacity metrics: This section provides a high-level summary of capacity utilization and system performance. This helps operators track infrastructure load and plan for scalability based on peak usage trends.
Views breakdown by content, Device, and device group: helps operators understand which content formats drive the highest engagement. Enables operators to optimize content delivery for the most-used devices. Helps in analyzing multi-device usage and cross-platform engagement.
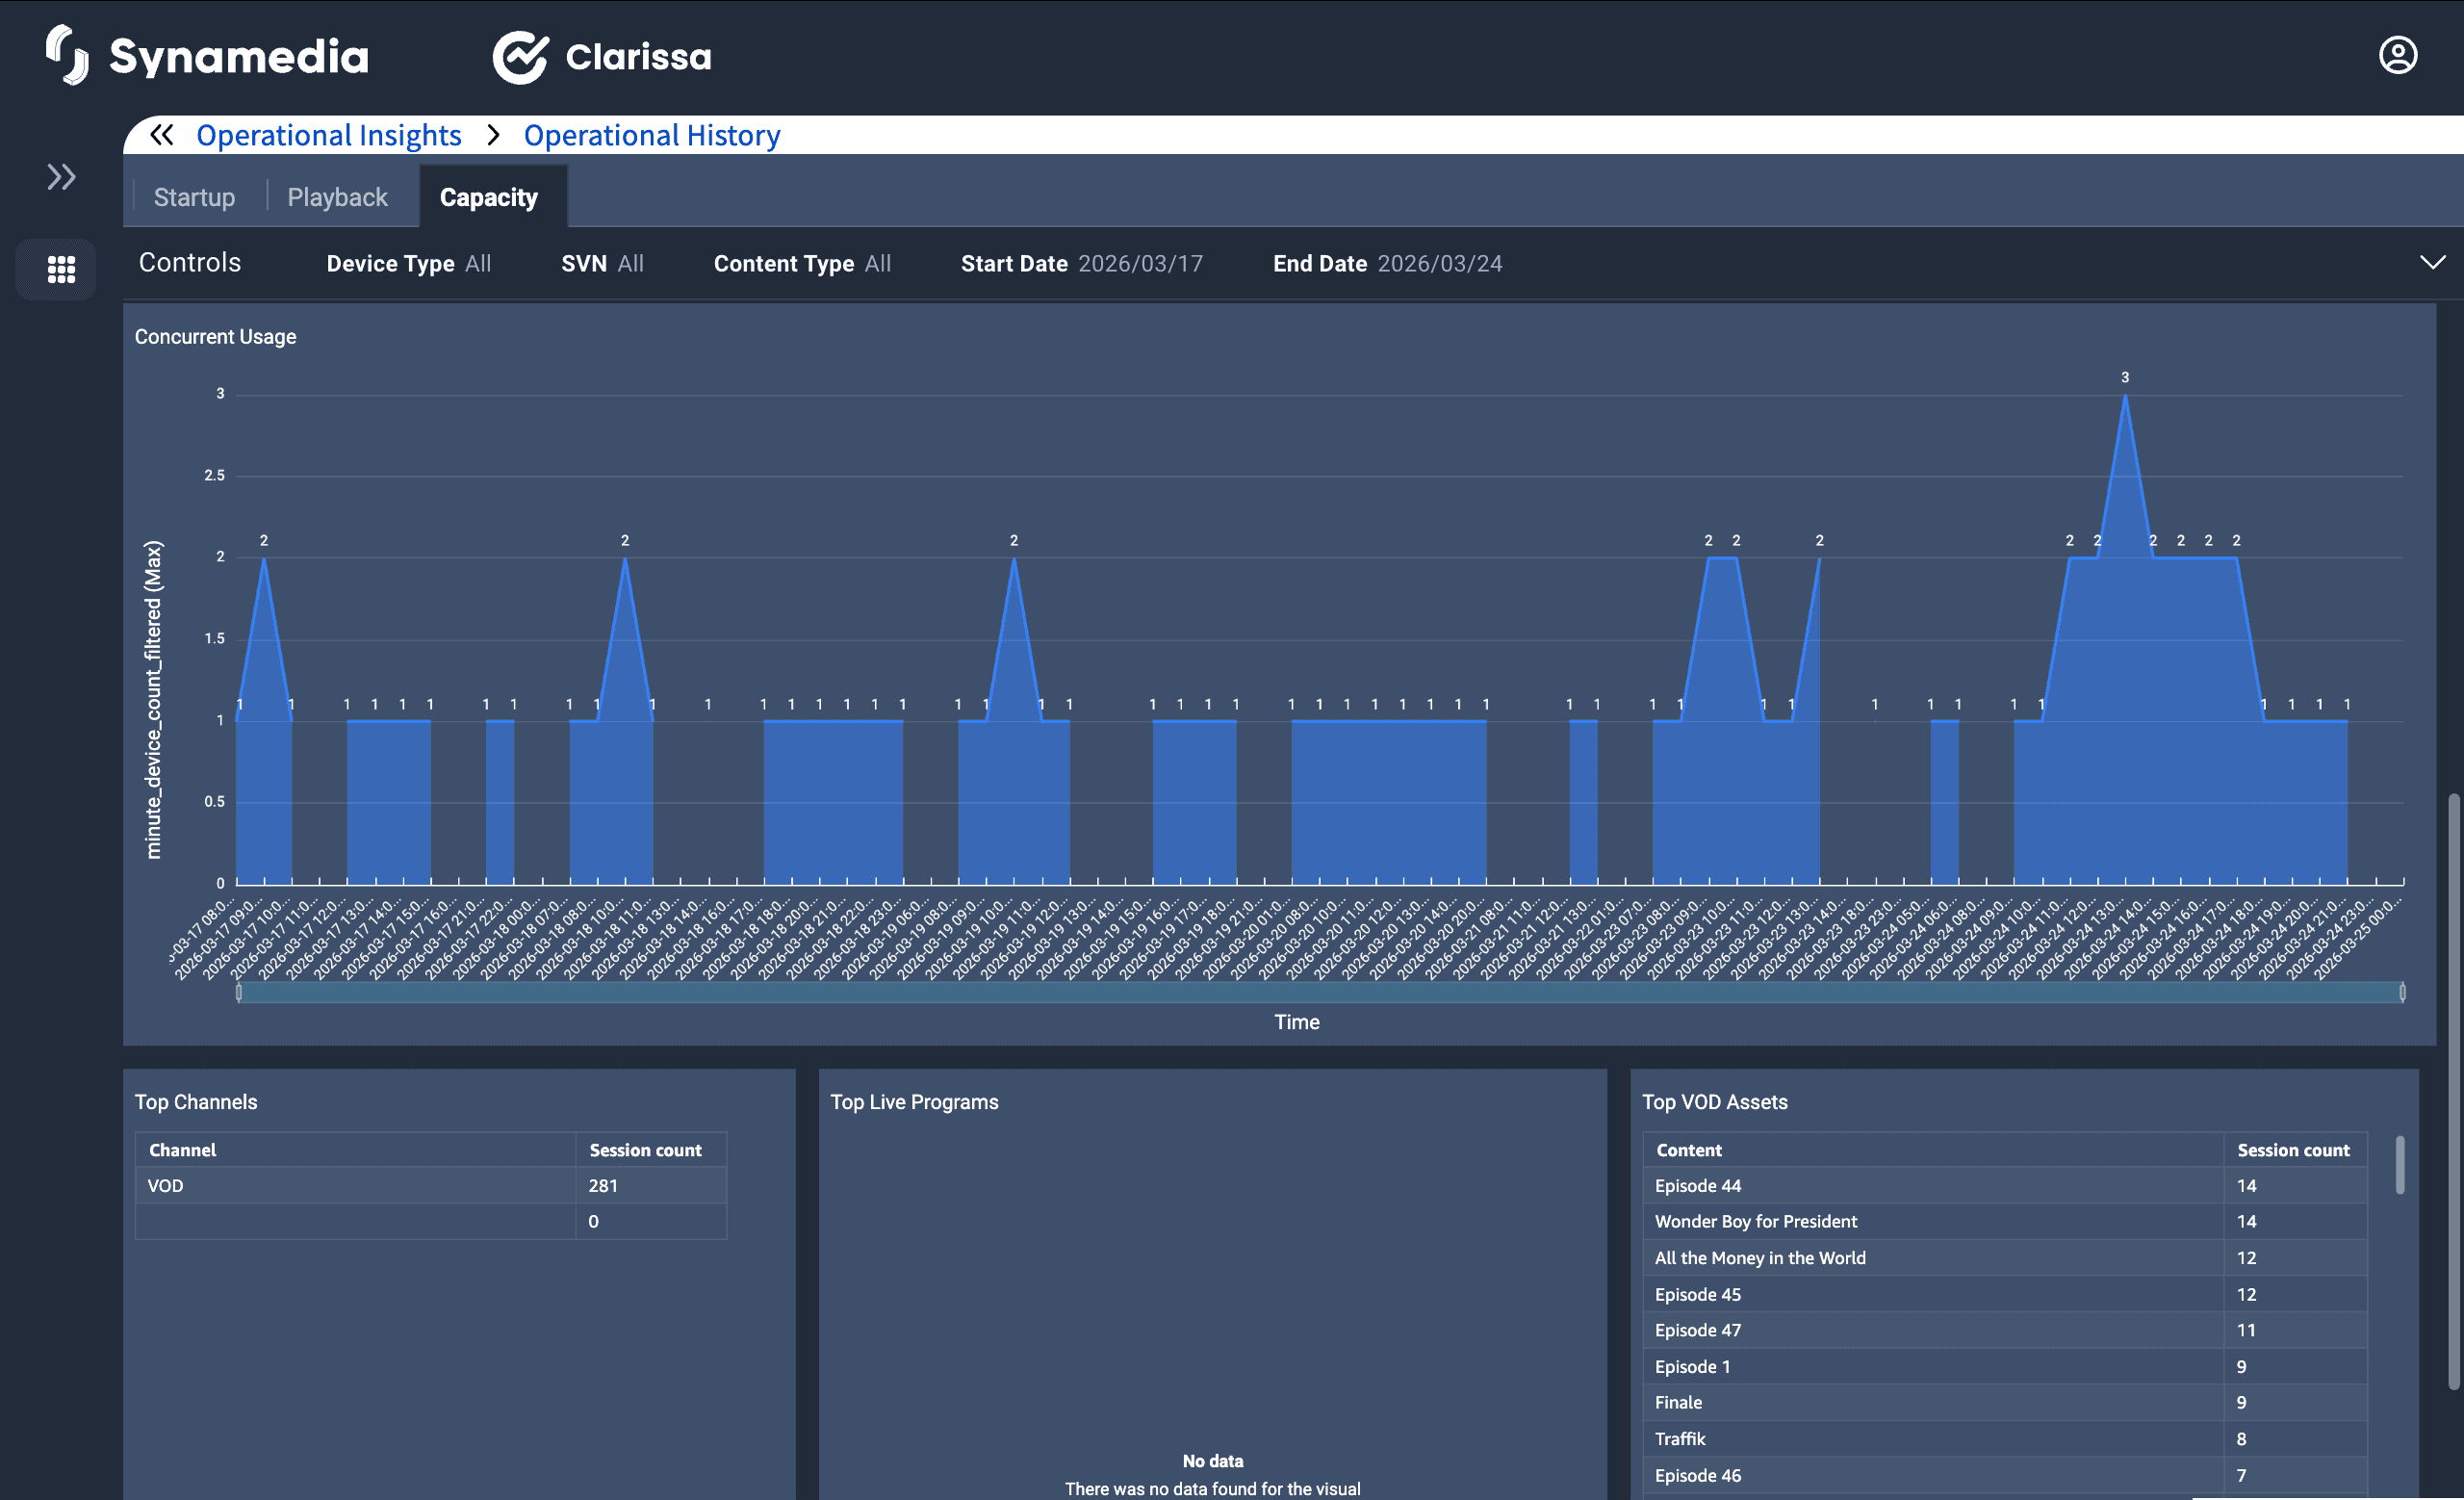
Concurrent usage trends: This section provides insights into how system load fluctuates over time. Allows operators to predict peak loads, optimize bandwidth allocation, and prevent service degradation.
Content consumption trends: Helps in prioritizing high-performing channels and allocating resources effectively. Assists in identifying popular live events and ensuring infrastructure readiness. Enables operators to optimize VOD libraries and improve content recommendations.
The Capacity Dashboard provides critical insights to help operators:
Ensure optimal system performance by tracking concurrent usage trends.
Prevent service degradation by identifying peak usage periods.
Optimize content delivery by analyzing viewing trends across devices.
Improve infrastructure planning based on real-time capacity utilization data.
By leveraging these insights, operators can enhance service reliability, improve content engagement, and ensure seamless streaming experiences.
Operational History extends the Operational Insights capability by providing access to historical performance data across the key analysis areas: Startup, Playback, and Capacity. While the standard Operational Insights dashboards focus on real-time and near real-time monitoring, Operational History enables operators to review and analyze trends over past days.
Operational History stores time-series data from Operational Insights dashboards, allowing operators to track service performance over a defined historical window. This enables deeper analysis of recurring issues, performance degradation, and long-term usage patterns.
Key Capabilities
Historical Data Retention:
Stores past days of metrics related to Startup, Playback, and Capacity.
Trend Analysis:
Enables operators to identify patterns in errors, buffering, startup failures, and system load over time.
Comparative Insights:
Allows comparison between historical and current performance to detect regressions or improvements.
Root Cause Analysis:
Supports investigation of intermittent or recurring issues that may not be visible in real-time dashboards.
Scope of Data
Operational History includes historical views of the three primary Operational Insights dashboards:
Startup:
Startup success rates, errors (VSF, EBVS), and session attempts
Playback:
Buffering behavior, playback errors, and video quality metrics
Capacity:
Concurrent usage, device activity, and content consumption trends
Benefits
Improves operational decision-making through historical visibility
Enables proactive issue identification and resolution
Supports capacity planning and infrastructure optimization
Enhances service reliability by tracking long-term performance trends
Operational History complements the existing dashboards by extending Operational Insights from real-time monitoring to historical performance analysis, providing operators with a more complete view of service health over time.
