
overview
what's new
getting started
articles
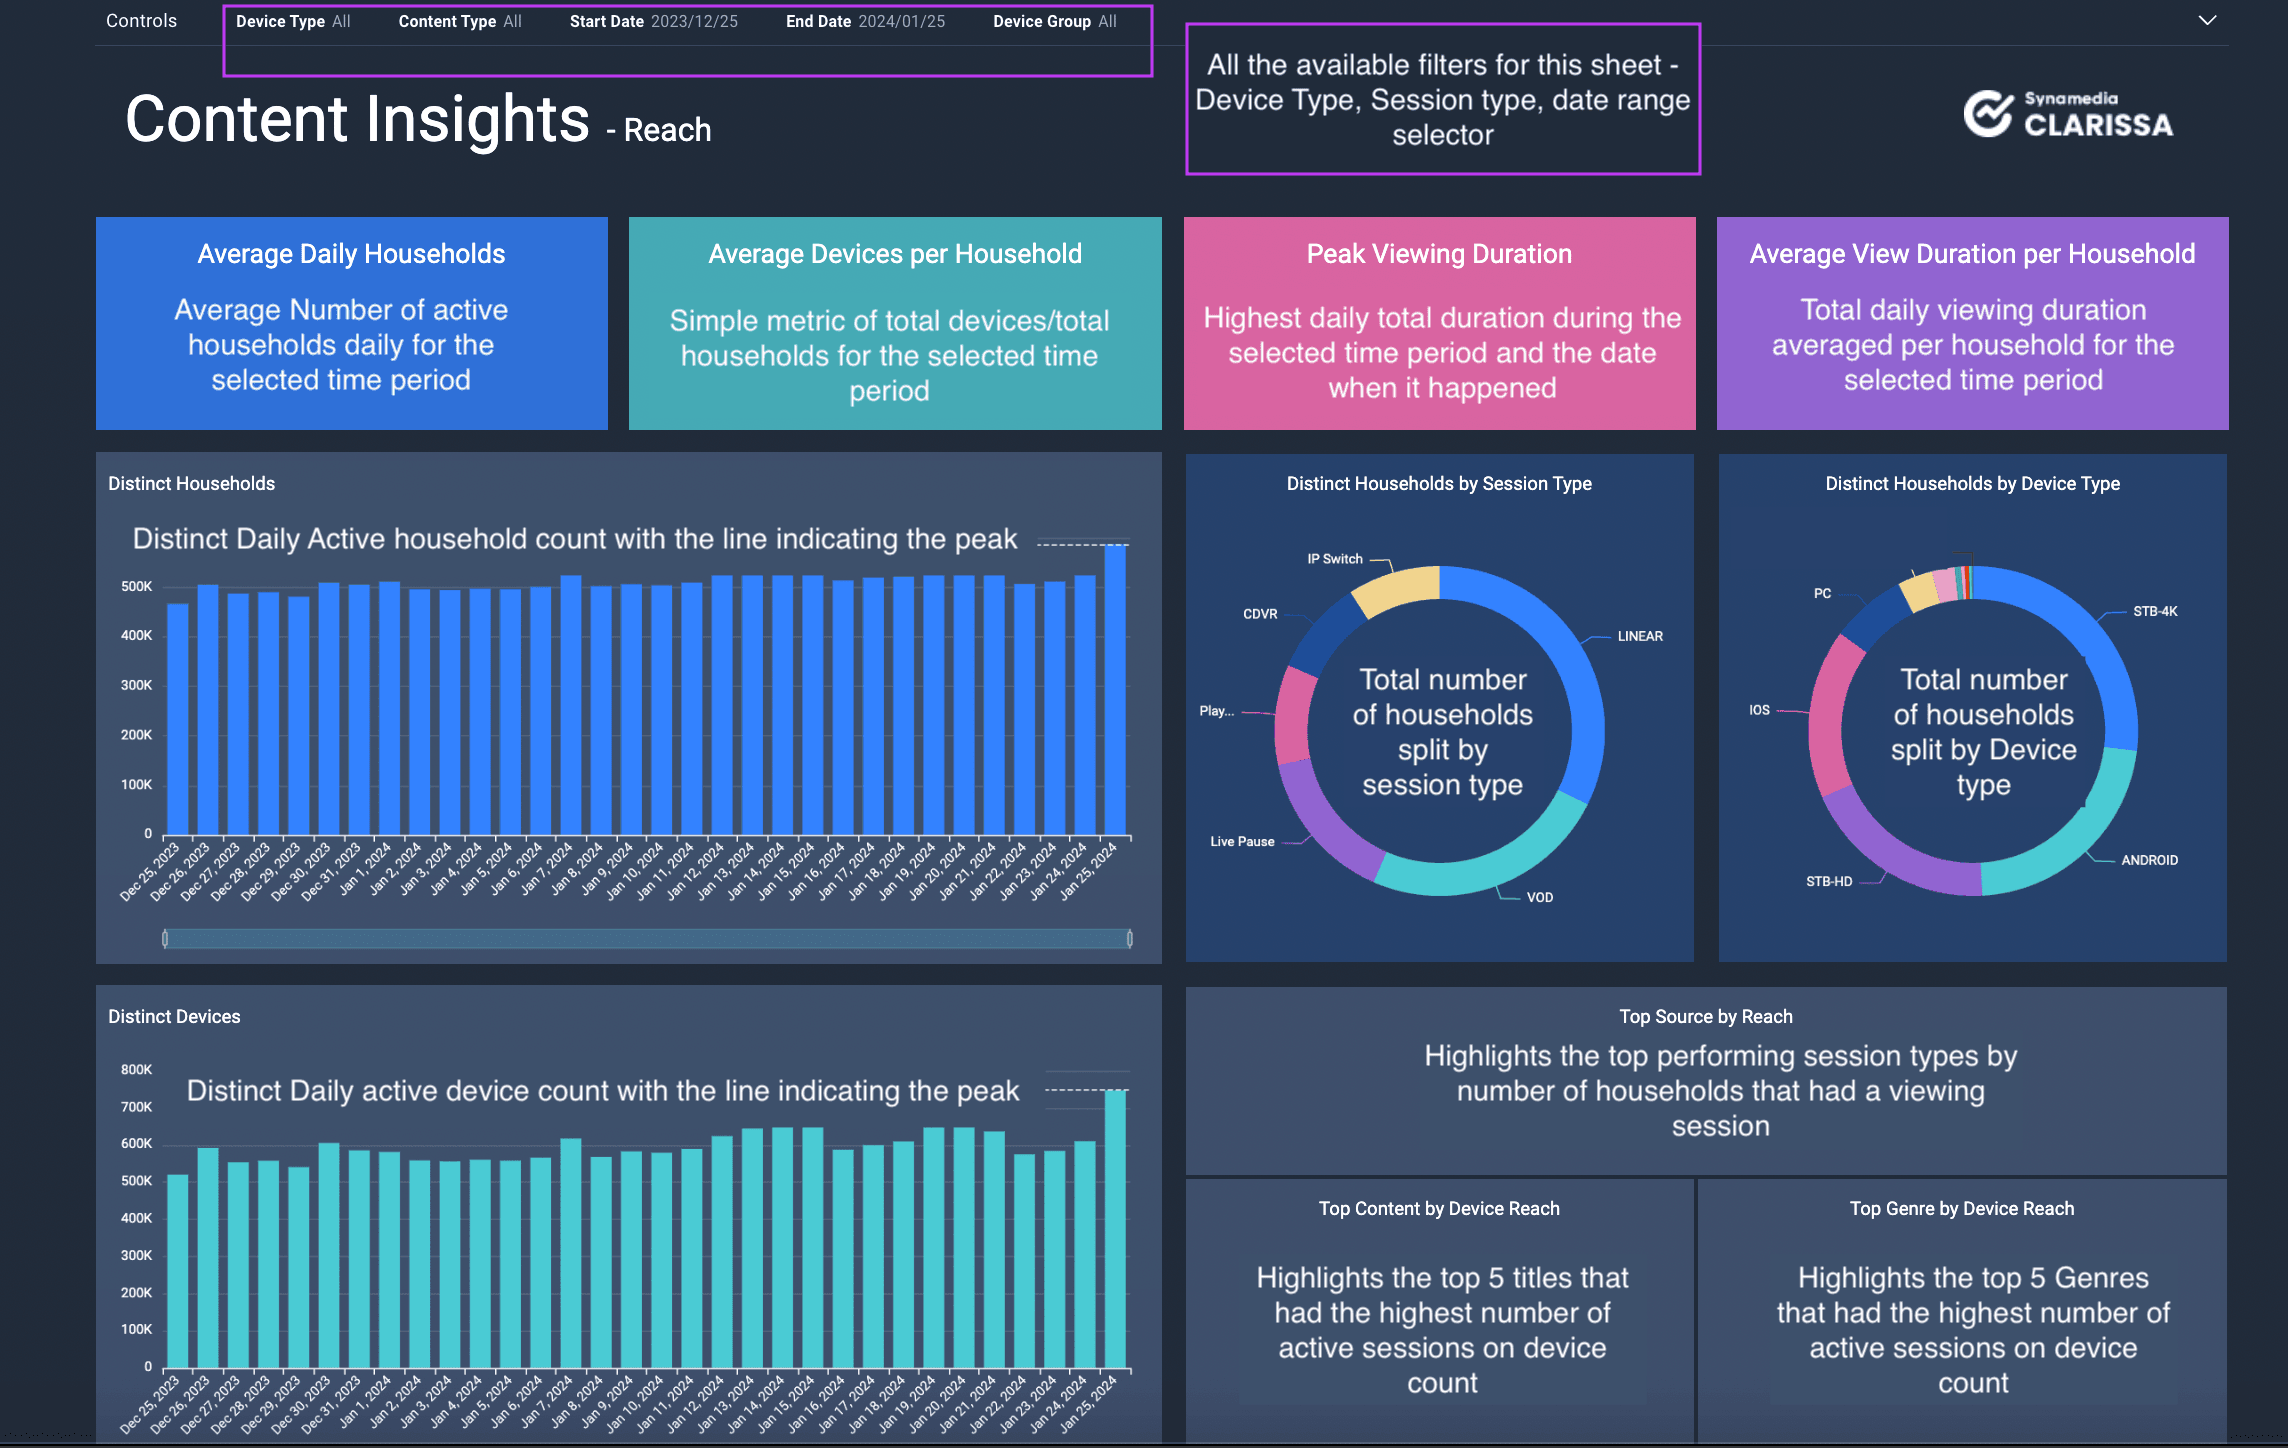
The Reach sheet is intended to capture all the charts and metrics from the Platform and Content Sheets provided in the old Clarissa dashboard tool.
Filters for device group (Main, Companion, both), device type (specific type of device) and session type are provided that to refresh the numbers and charts across the dashboard.
Default selections for filters will always be Both Device Groups and all Session types.
By default, date selection is for rolling 30 days. You can select your start and end date to review Reach and Engagement.
Average Daily Households – Average number of households that are active on a daily basis during the specified time period
Average Devices per Household – The average number of devices per household during the specified time period
Peak Viewing Duration – The day within the chosen time frame that recorded the highest total viewing minutes
Average viewing duration per household – The average total viewing minutes per household on a daily basis during the selected time period.
A new introduction in the new Clarissa dashboards is to create dynamic boxes that provide insights on performance and reach of top content.
In the top section of Reach where the focus is entirely on Device and HH count, we look at the best performing (top 5) Content, Genre and Content Source that has had the most active device reach.
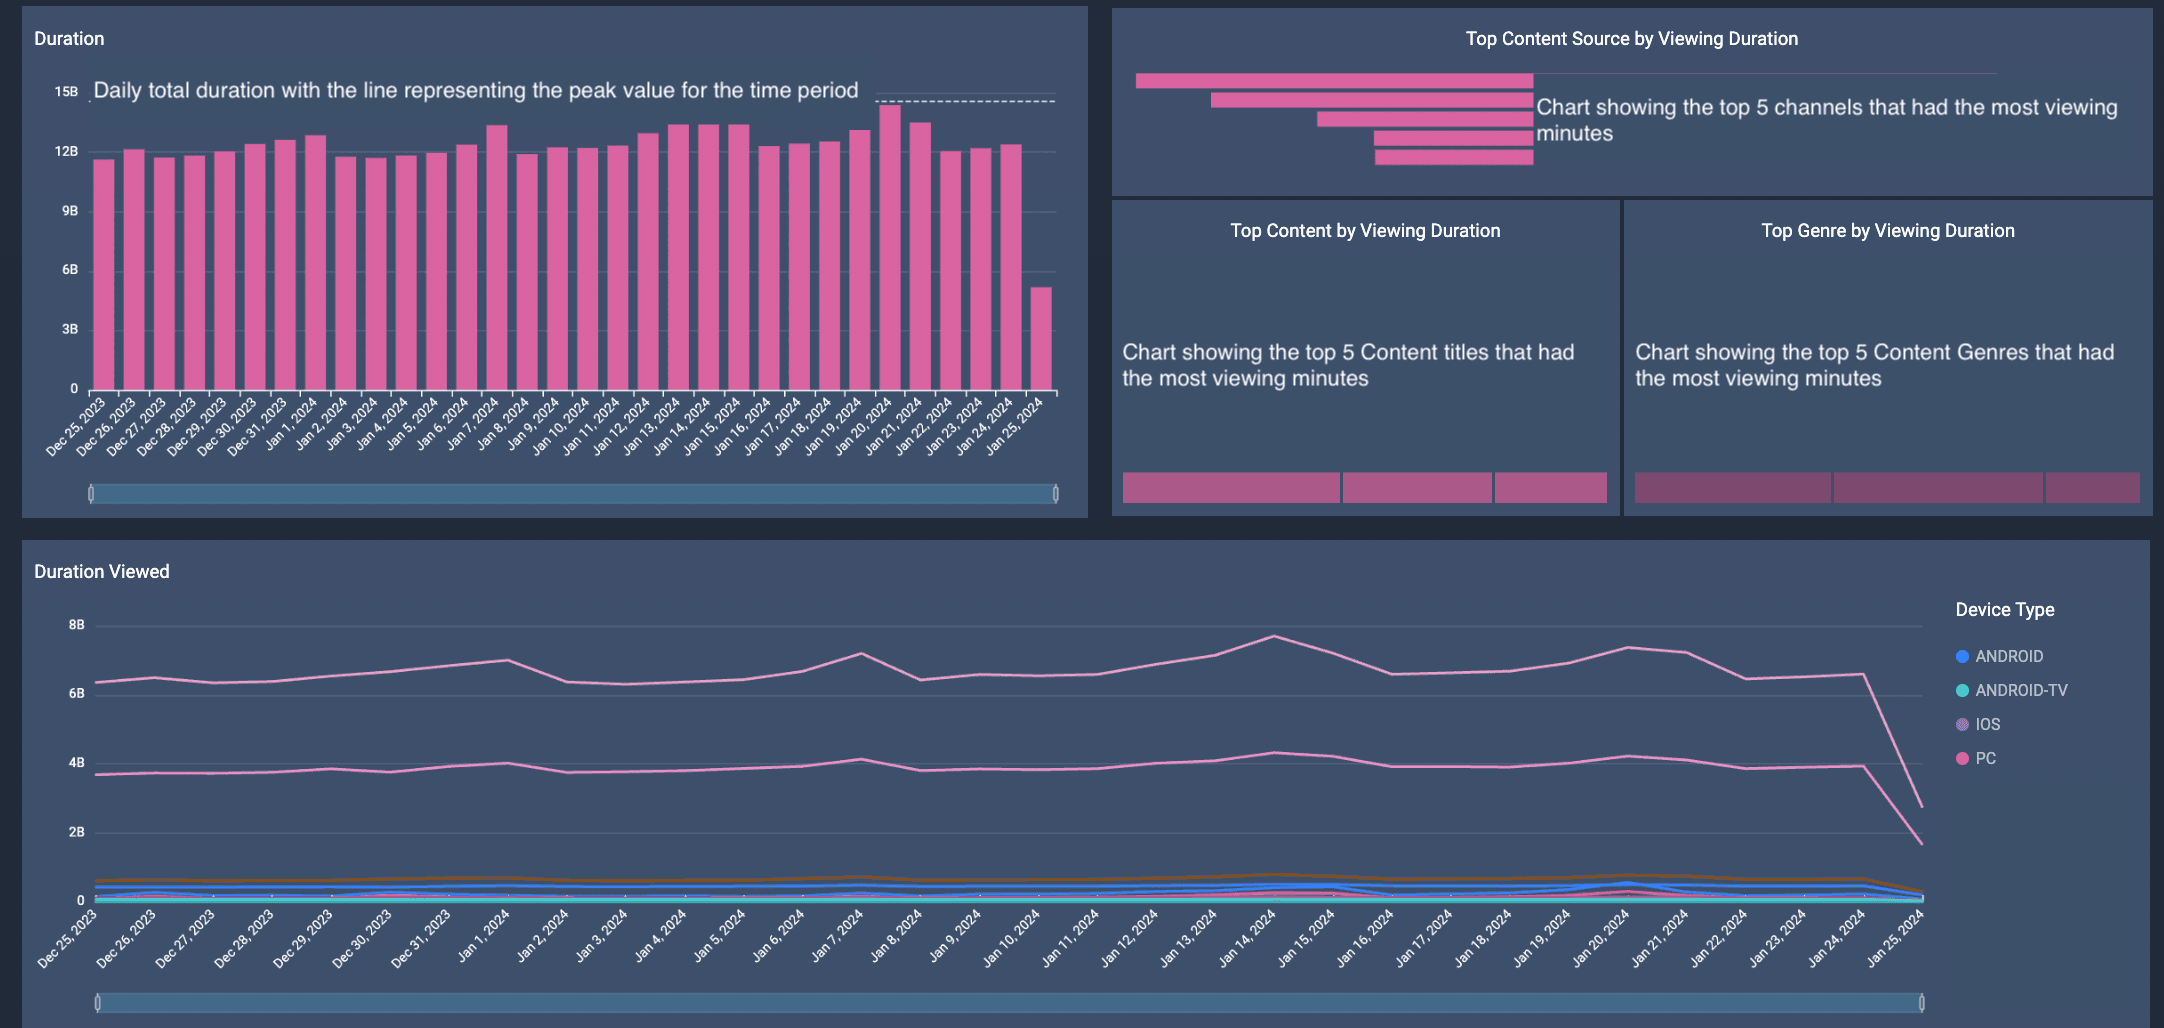
The focus in the middle section of the Reach Dashboard is Duration (Viewing minutes).
We feature a daily chart depicting total viewing minutes, followed by three Insights trends related to Viewing Duration. Additionally, there is a a chart illustrating the daily breakdown of total viewing minutes by device type.
We analyze the top performing (top 5) Content, Genre and Content Source based on the highest number of viewing minutes.
The final part of the Reach sheet focuses on the Content Table that is now available on the Content Sheet in the Clarissa dashboards. You can easily sort the table based on any column by simply clicking on the '...' icon next to each column, although filtering directly within the table is not supported currently.
Next Article - Trends Sheet User Guide