The Features sheet aims to capture all the charts and metrics from the Features and Feature Details Sheets provided in the old Clarissa dashboard tool.
Filters for device group (Main, Companion, both), device type (specific type of device) and session type are provided to refresh the numbers and charts across the dashboard. Default selections for filters will always be Both Device Groups, all Sessions and all Feature types.
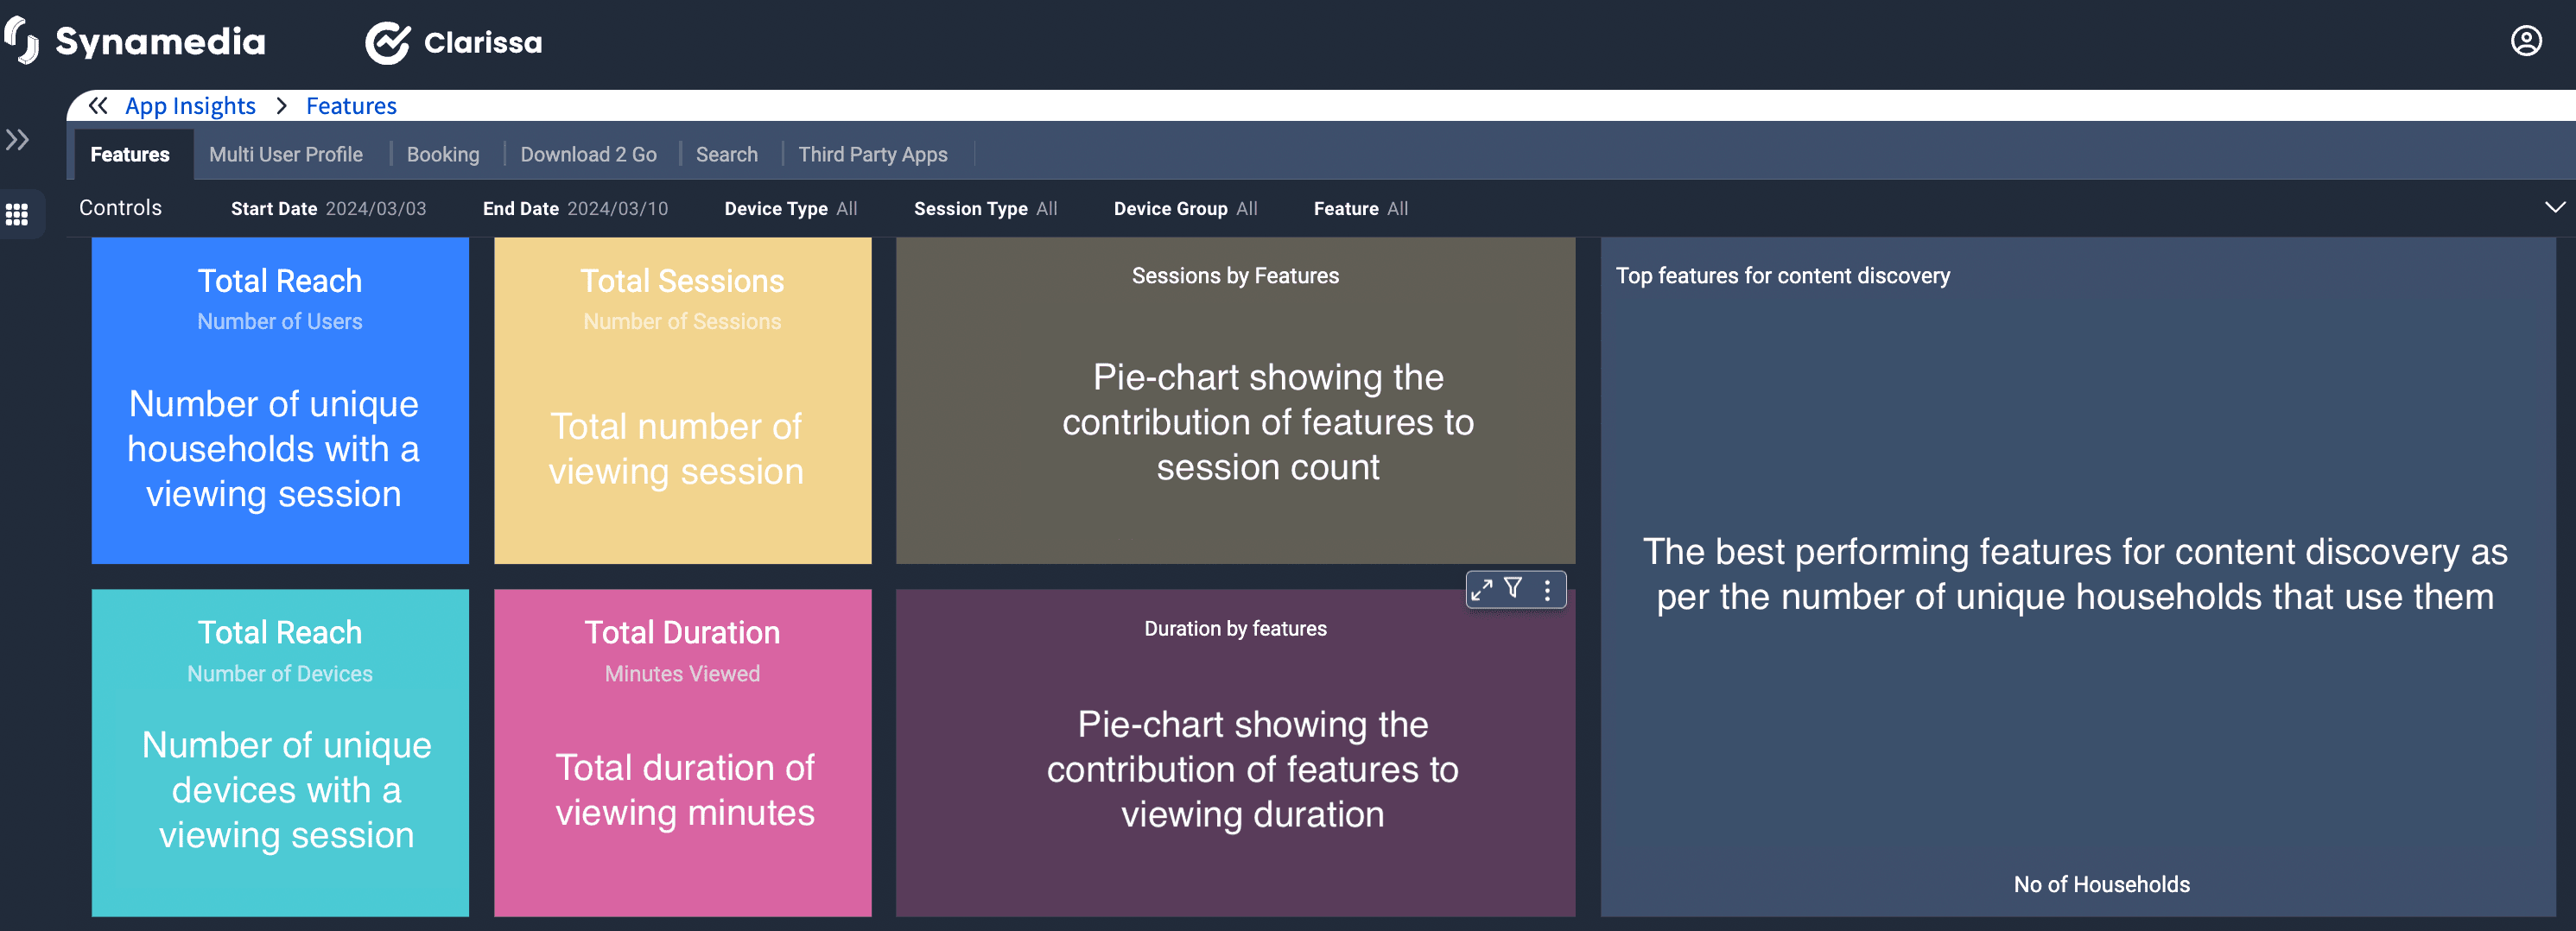
By default, the date selection is set to a rolling 35-day period. You have the option to choose your own start and end dates to analyze Feature performance.
Reach is captured by
Total Households – Total number of unique active households for the selected duration.
Total Devices– Total number of unique active devices for the selected duration.
Session Count – Total number of active sessions .
Total viewing duration – Total viewing minutes for the selected duration.
Across each of the feature sheets, the main charts have changed to reflect the best way to present the usage of that feature.
The 2 pie charts focus on the contribution of the session counts or duration from each of the features in the playback sessions they facilitate.
When looking at content discovery features, it is useful to see the reach of the feature on unique households using it.
When looking at content discovery features, the Return to feature graph focuses on how often in the selected time period, the user has returned to that feature. This is especially relevant when launching a new feature – while in the early phase of launch, with a marketing and advertising campaign doing their work, everyone wants to try the new feature. However, after week 2, only the engaging features continue to perform with a return to feature metric.
The right hand side section highlights the top 5 features by device count, session count and viewing duration.
The final part of the Features main tab sheet focuses on the detailed breakdown of each feature by household reach, session count and session viewing duration.
Next Article - Multi-User Profile and Booking Features User Guide
