
The short video below walks through the Overview dashboard: reading the summary cards, spotting errors and warnings, checking the transcoding and packaging queues, and jumping from a card straight into the area that needs attention.
The Overview is the landing page of VOD Management and gives you a single, at-a- glance view of the health of your on-demand content pipeline. It summarises what has happened over the last 24 hours – how much content was processed, what is still in progress, and what needs your attention – so you can decide where to look next.
Think of it as your starting point: you read the dashboard first, and then click through to the detailed area (Assets, Data Plane, and so on) to investigate or act on anything that stands out.
The module is opened from the sidebar under: System Configuration / VOD Management > Overview (the Overview is shown automatically when you open VOD Management).
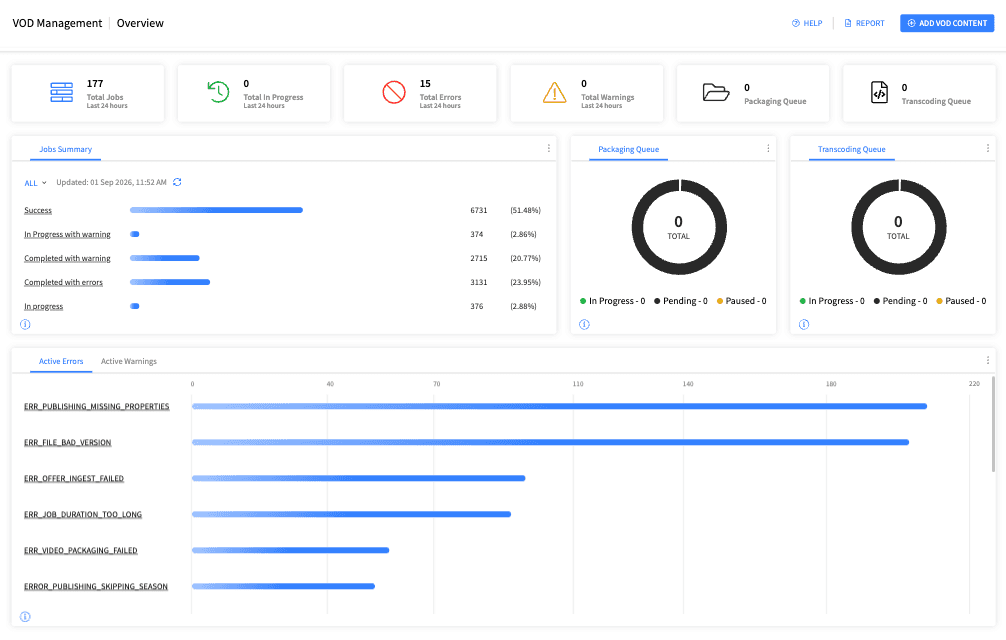
The Overview is made up of summary cards. Each card shows a number for the last 24 hours, together with an icon and a short label. The typical cards are:
Total Jobs – the total number of ingest jobs handled in the last 24 hours.
In Progress – jobs that are currently being processed.
Errors – jobs that failed and need attention.
Warnings – jobs that completed but raised a warning.
Transcoding Queue – the number of transcoding tasks currently being worked on.
Packaging Queue – the number of packaging tasks currently being worked on.
Every card is scoped to the last 24 hours, shown by the "24hr" label on the card.

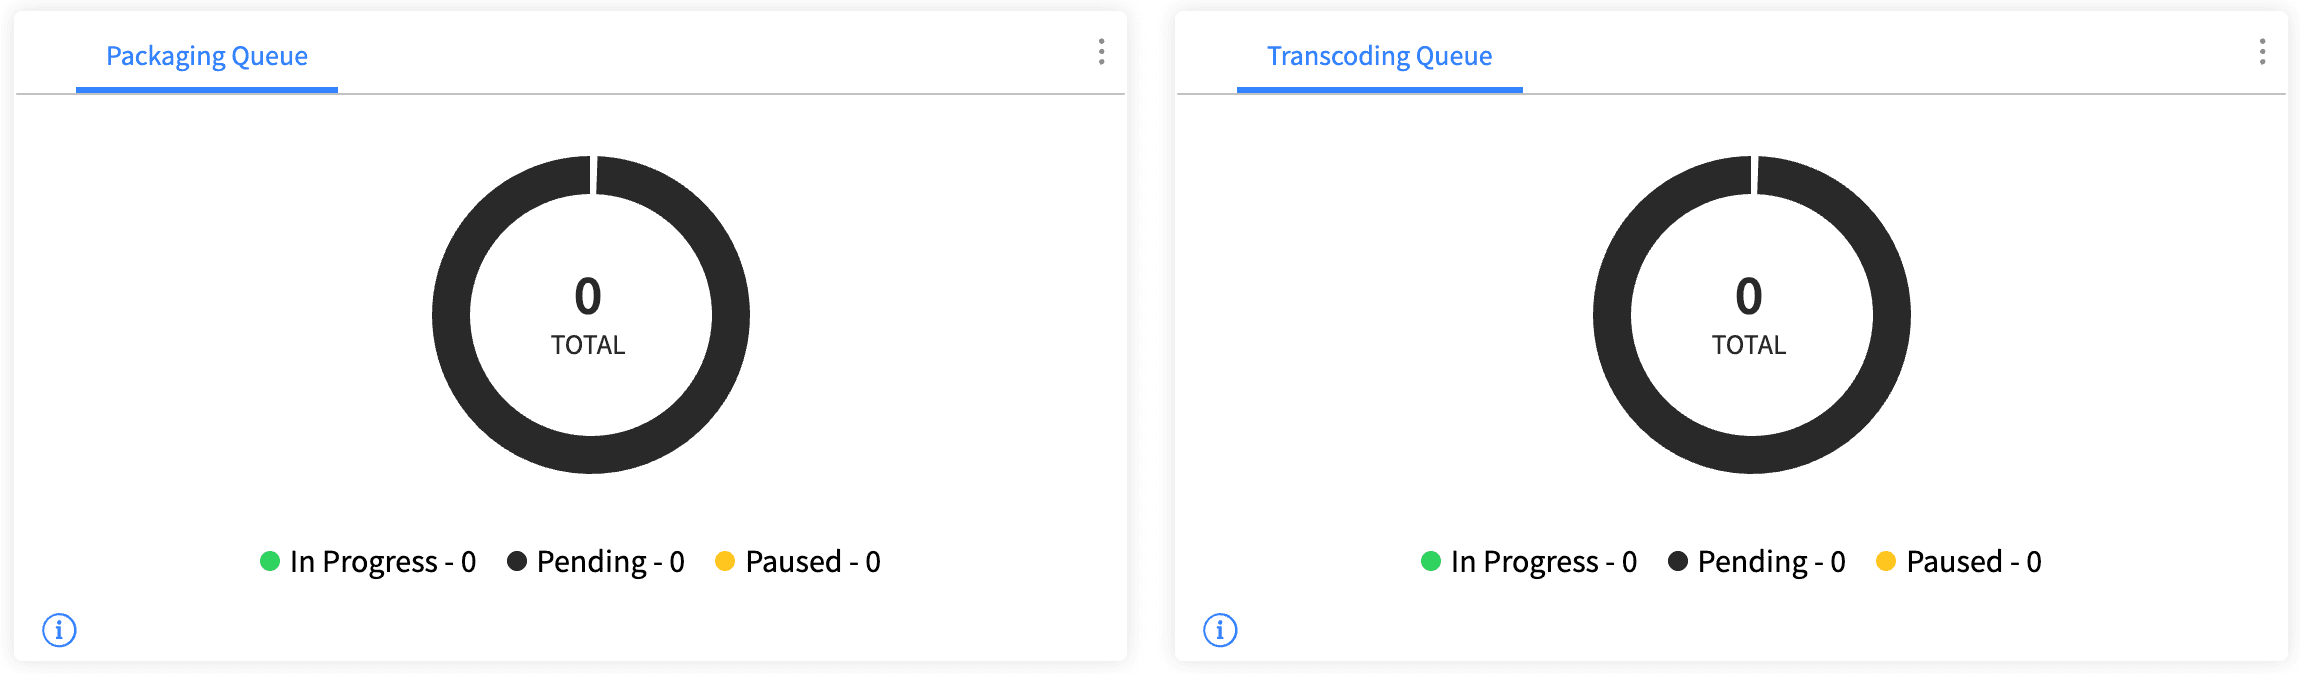
The Transcoding Queue and Packaging Queue cards tell you how busy your video processing is right now:
A number on the card shows how many tasks are active.
If a queue has been temporarily halted, the card shows a "Paused" indicator (a pause icon with a "Polling paused" tooltip). A paused queue means content is not being processed until it is resumed.
If both queues are switched off for your deployment, the queue cards are hidden.
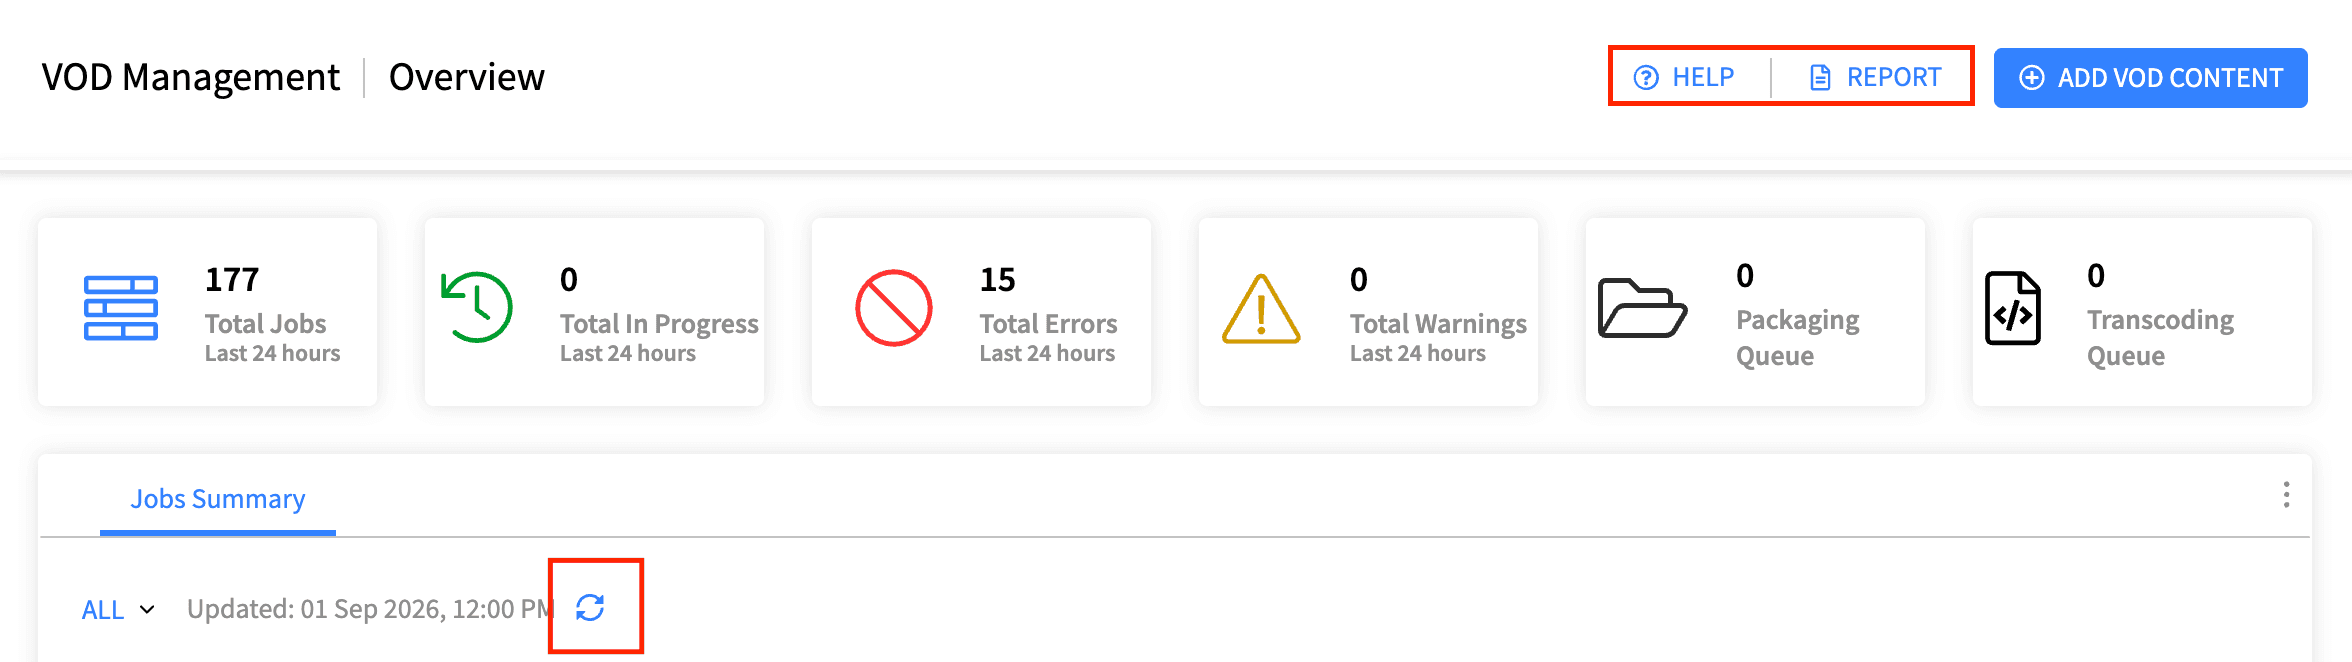
At the top of the screen you also have:
Help – opens a menu with links to the VOD Management documentation.
Report – downloads a catalogue report to your machine.
Refresh – reloads all the cards with the latest figures. The dashboard also refreshes on its own so the numbers stay current.
1. Open VOD Management – the Overview appears first. 2. Scan the cards for anything unusual: a high Errors count, a large or paused queue, or an unexpected number of in-progress jobs. 3. Click the card that concerns you to jump to the detailed list. 4. Investigate and act in that area (for example, retry a failed task in Data Plane, or open an asset in Assets). 5. Come back to the Overview to confirm the numbers are moving in the right direction.
- Start every session on the Overview – it is the quickest way to see whether anything needs attention before you dig into detail. - Watch the queue cards closely. A steadily growing Transcoding or Packaging queue usually means processing is falling behind. - A "Paused" queue will not process new content until it is resumed – if content seems stuck, check the queue status here first. - Remember the cards are clickable. Use them to jump straight to the filtered list rather than searching manually. - All figures cover the last 24 hours. For longer-term analysis, use the detailed areas and their export options instead.



