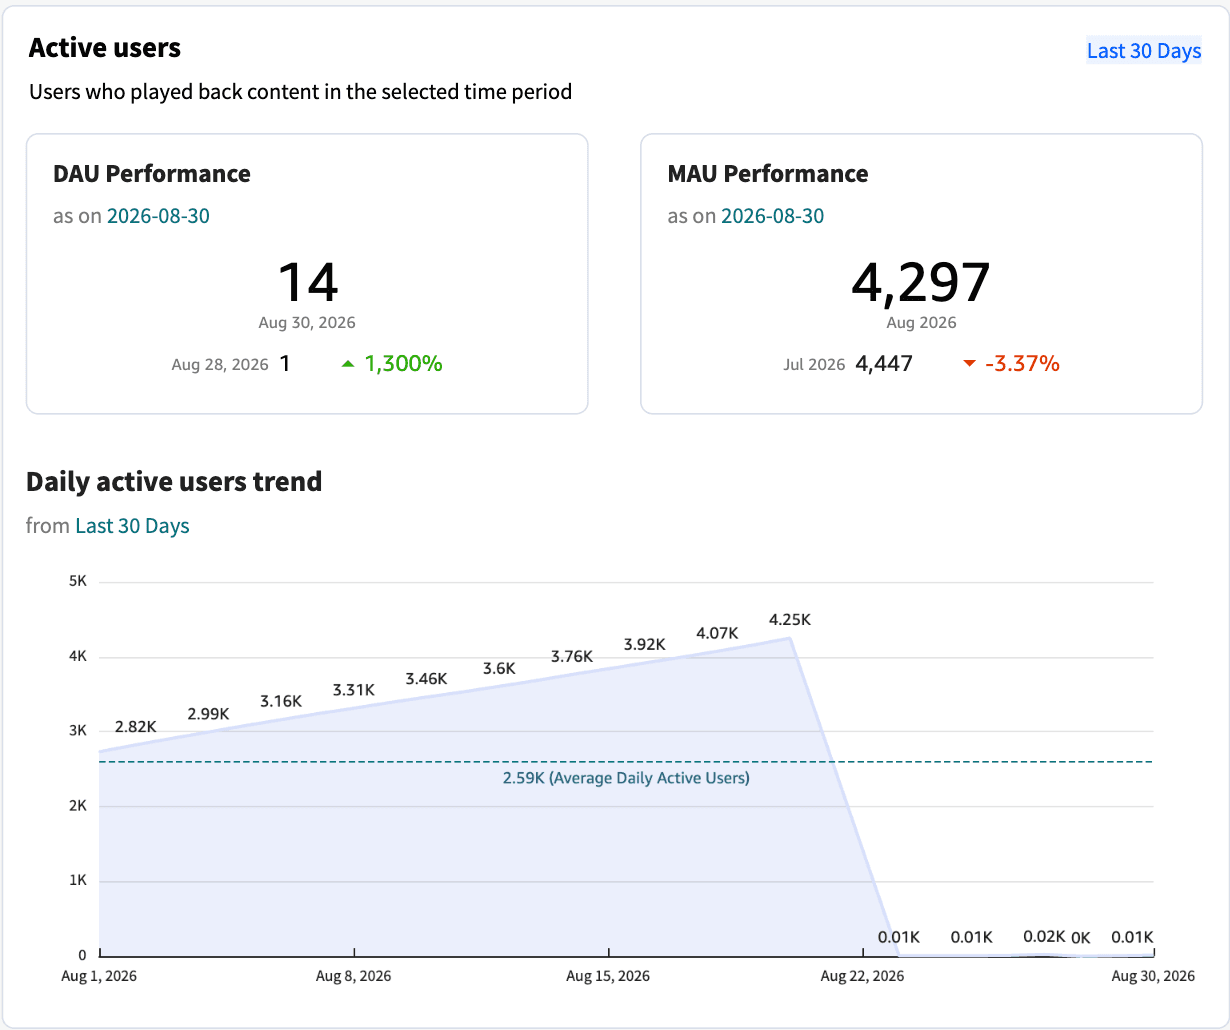
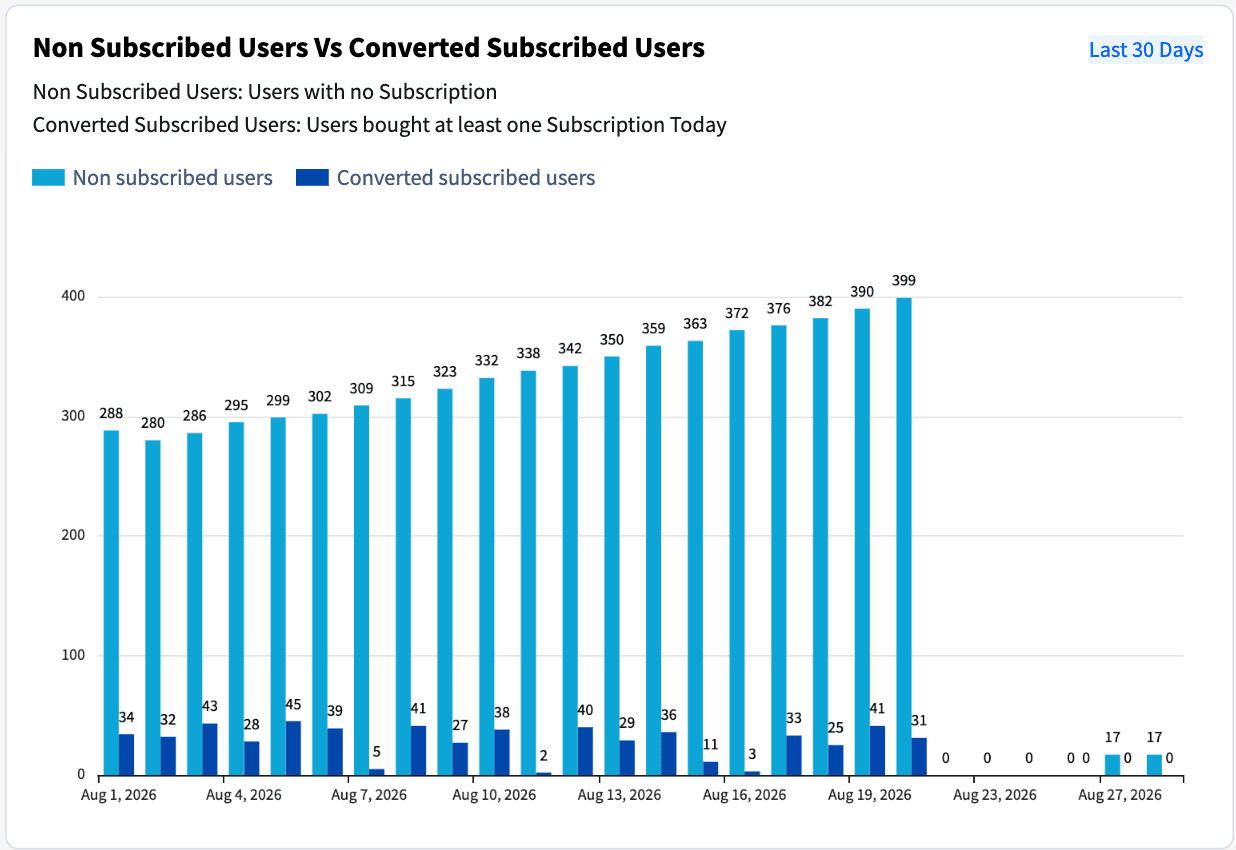
Subscriber Insights — also referred to as GO Analytics — gives you a ready-made analytics dashboard for your operation. It presents key subscriber metrics and trends so you can understand how your service is being used, without having to build reports yourself.
The dashboard is fully interactive: you can filter, drill into, sort, and export the data directly from within the dashboard itself. The data shown is scoped to your own tenant only — you never see another operator’s data.
The module is opened from the sidebar under: Analytics > Subscriber Insights
There are no forms to fill in and nothing to configure on this screen — it is a read-only view of your analytics.

Subscriber Insights is only available to users whose role grants the "Subscriber Insights - View" permission. If you do not have this permission, the Analytics section (or the Subscriber Insights entry) does not appear in your sidebar. If you expect to see it and do not, ask your administrator to review your role assignment.
In the sidebar, expand the "Analytics" section.
Click "Subscriber Insights".
The dashboard loads in the main area of the console.
While the dashboard is being prepared you briefly see a loading spinner. This is normal — the console is securely fetching your tenant’s dashboard before it is displayed.
Once loaded, the dashboard is interactive. Depending on how your dashboard has been set up, you can typically:
Filter the data (for example by date range or category) using the controls shown on the dashboard.
Hover over a chart to see the exact values behind a data point.
Drill into a chart element to see more detail.
Sort tables by clicking a column header.
Export or download data and visuals using the dashboard’s own export/menu controls.
All of these actions happen inside the dashboard view. Your selections affect only what you see on screen — they do not change any underlying configuration or data.
The dashboard always shows data for your tenant only.
Analytics data is collected and refreshed on a schedule, so the most recent activity may take some time to appear. The dashboard reflects the latest data that has been processed, not real-time activity.
Your view of the dashboard stays available for the length of your session. If you leave the page open for a long time and it stops updating or shows a session/timeout message, simply reopen Subscriber Insights from the sidebar to refresh it.
Instead of charts, you may sometimes see a message that reads:
"Your insights are on the way" — "We’re gathering data — analytics will appear here shortly."
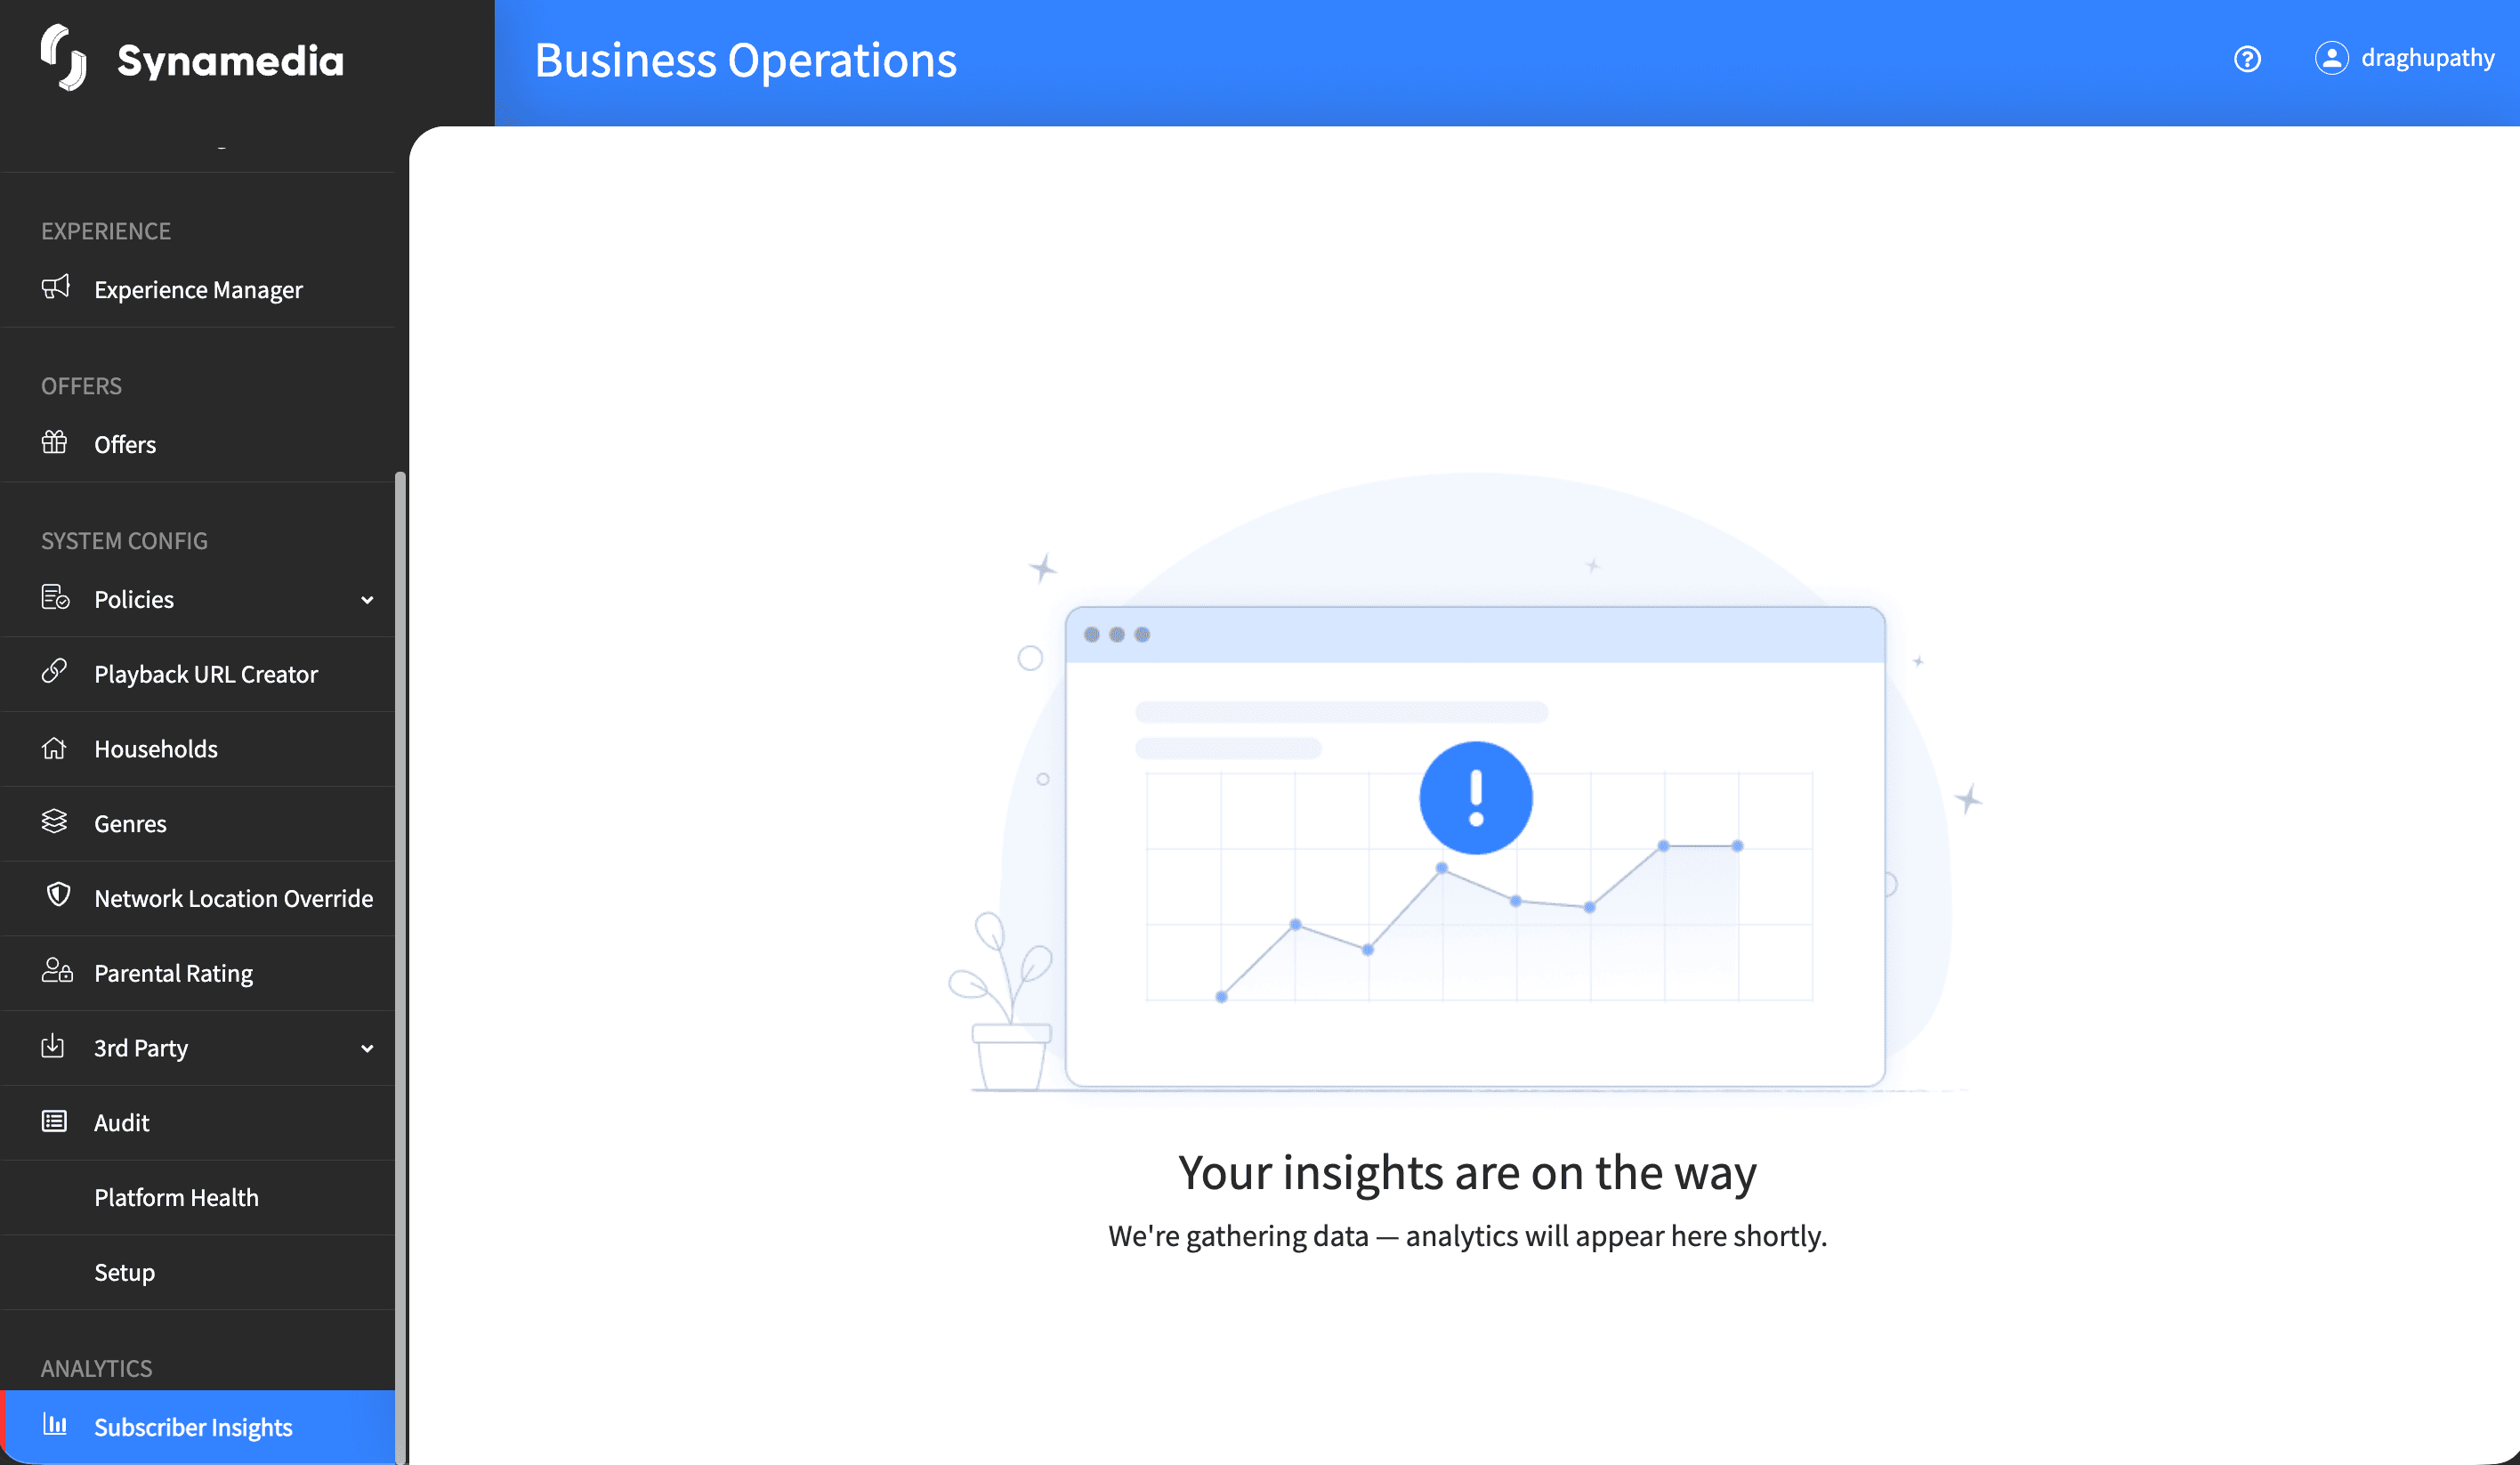
This means the console connected successfully but there is no dashboard to display for you yet. The most common reasons are:
Analytics for your tenant has not finished being set up.
There is not yet enough data collected to populate the dashboard.
A temporary issue prevented the dashboard from being retrieved.
What to do:
Wait a short while and reopen Subscriber Insights from the sidebar.
If the message persists after a reasonable time, contact your administrator or support so they can confirm that analytics has been provisioned for your tenant.
The Subscriber Insights entry is missing from the sidebar: You most likely do not have the "Subscriber Insights - View" permission. Ask your administrator to review your role.
The screen keeps showing the loading spinner: Reload the page. If it still does not load, check your network connection and then contact support.
The "Your insights are on the way" message appears: See the section above — this usually means analytics is still being set up or has no data yet for your tenant.
The dashboard loaded earlier but now looks stale or unresponsive: Reopen Subscriber Insights from the sidebar to start a fresh session.
Subscriber Insights is for viewing and analysing data only. Nothing you do on this screen changes any customer, household, or system configuration.
Use the dashboard’s own filter and export controls to build the exact view you need, then export it if you want to share it outside the console.
Remember the data is refreshed on a schedule — use it for trends and insight rather than as a live, second-by-second monitor.
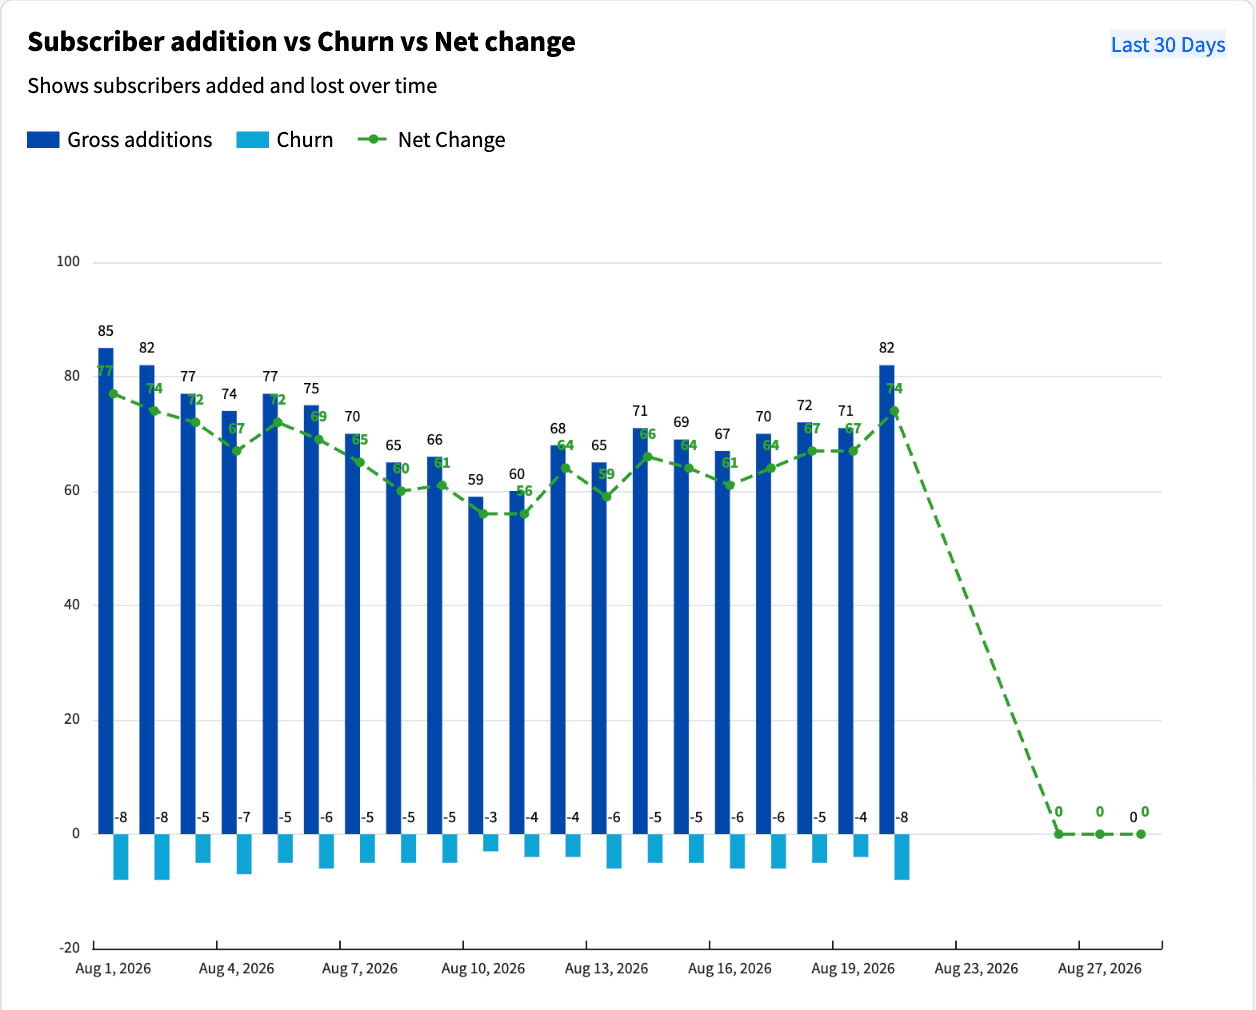
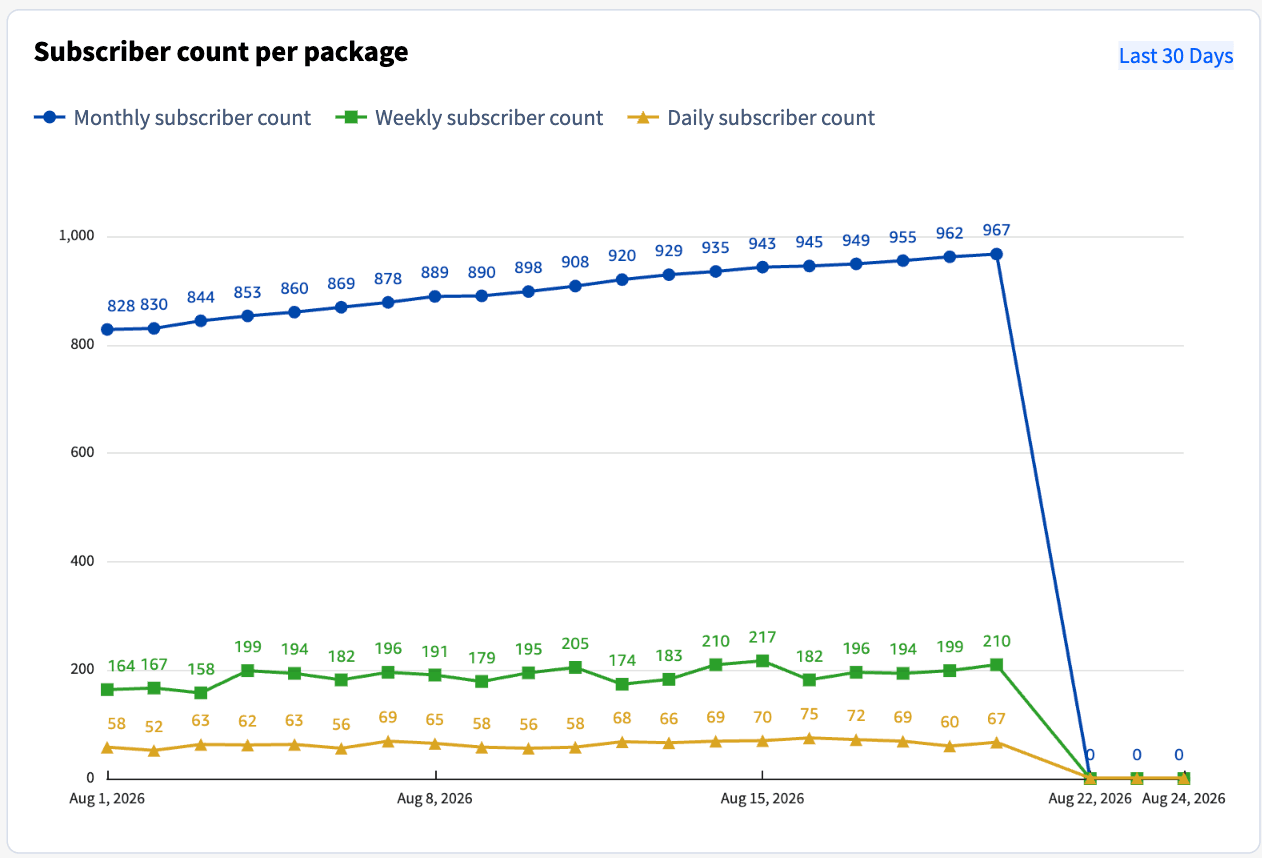
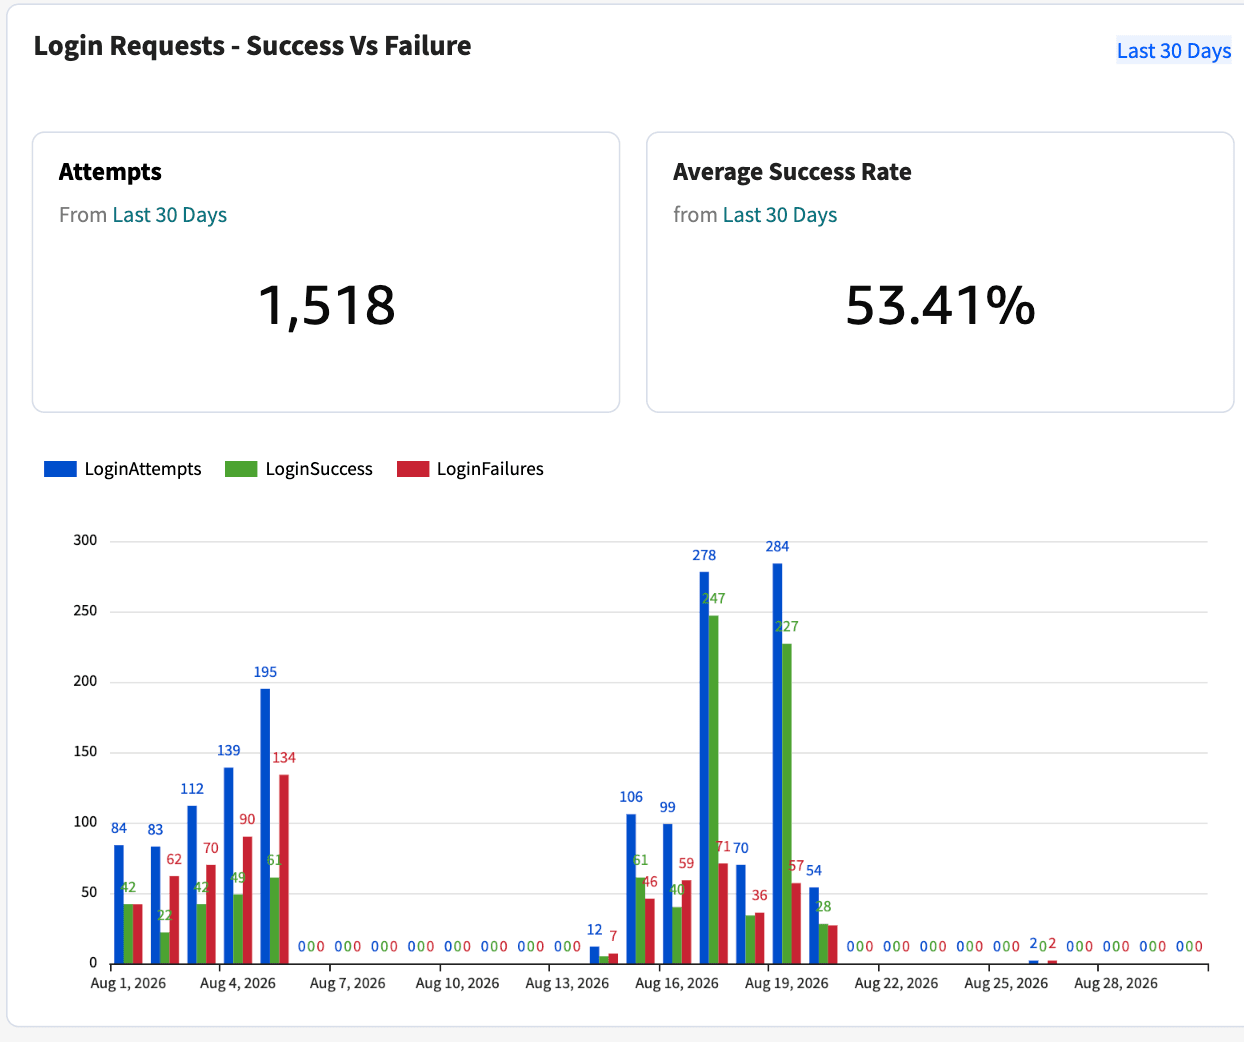
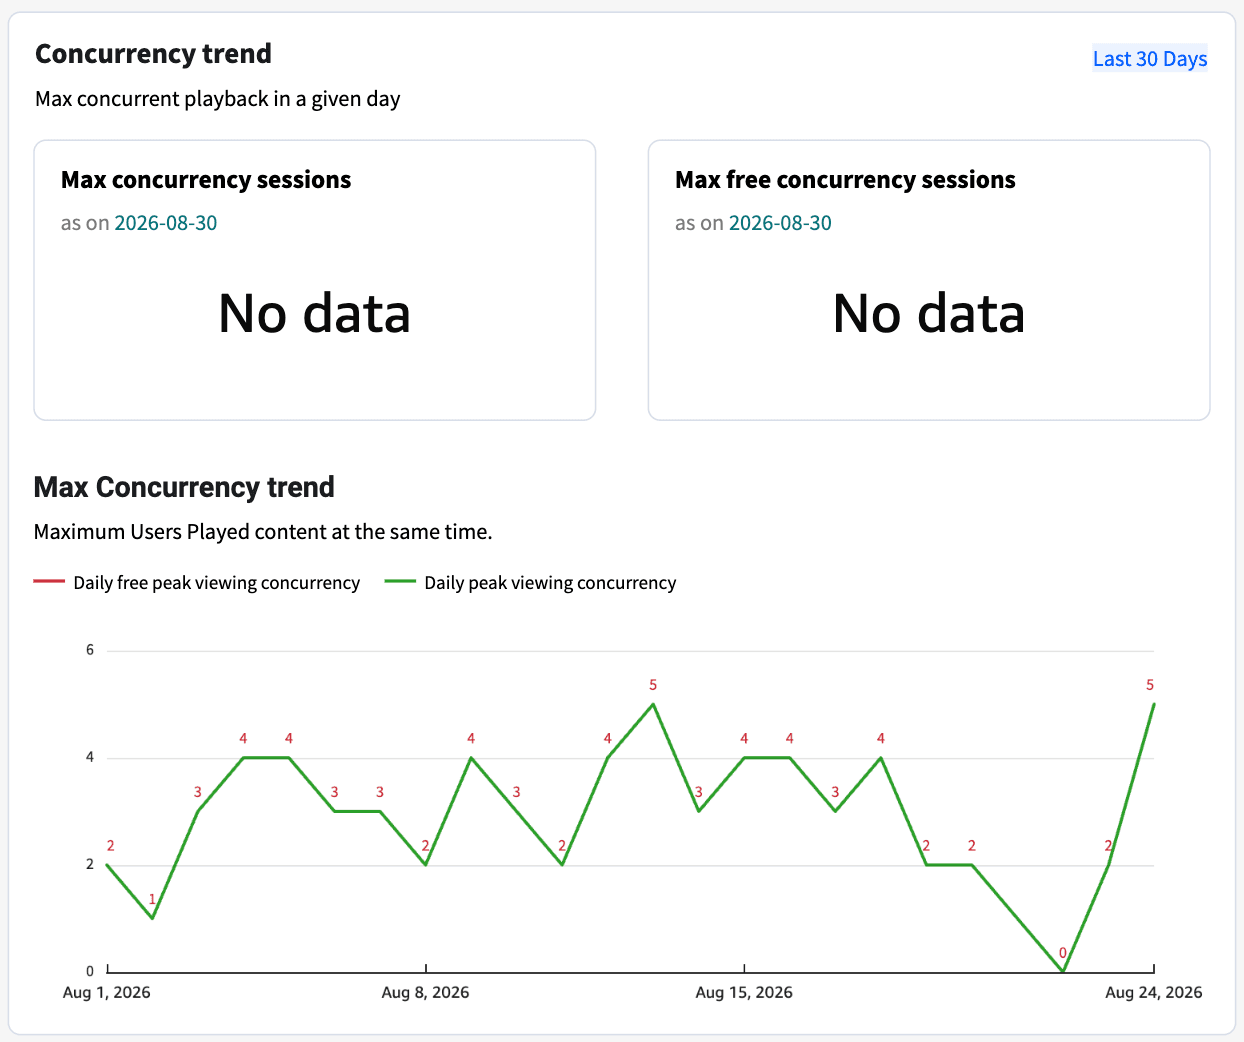
The screenshots below show example Subscriber Insights dashboards to give you a sense of the metrics and layouts available.