


The Platform Health Dashboard is the operator-facing observability workspace available within OpsHub. It provides a consolidated, real-time view of system health across Client API, Back Office API, Playback, Schedule Ingest, and VOD Ingest — allowing operations teams to monitor service quality without direct access to backend telemetry systems.
The Platform Health Dashboard is a Grafana-based monitoring interface embedded within the OpsHub portal. It surfaces key operational metrics collected by ServiceNow Cloud Observability (Lightstep) and presents them as stat panels, bar charts, histograms, and timeseries graphs. The dashboard is designed for at-a-glance health assessment and trend analysis.
Monitor request volumes and error rates for Client and Back Office APIs
Track playback session health and content type distribution
Observe schedule ingest success rates for full and partial ingests
Review VOD ingest health on daily and weekly time windows
Identify latency trends and percentile breakdowns
View color-coded threshold indicators for rapid triage
Operations engineers and NOC teams
Support supervisors monitoring platform stability
Service reliability teams performing trend analysis
Administrative users with monitoring permissions
Concept | Description |
Tenant | An isolated operator deployment. All dashboard panels (except system-wide ingests) are scoped to the selected tenant. |
Stat panel | A single-value display showing a metric such as request rate, success rate, or latency percentile. |
Bar chart | A visualization showing metric values grouped by category (e.g., HTTP status code or content type) over time. |
Timeseries | A line graph showing metric values plotted over time, used for trend analysis. |
Histogram | A distribution chart showing how latency values are spread across buckets. |
Success rate | The percentage of requests or operations that completed without error, calculated as (1 - errors/total) * 100. |
Threshold | A color boundary applied to a stat panel — green indicates normal, red indicates degraded. |
The Platform Health Dashboard is accessible from the OpsHub portal. Access is controlled by role-based permissions configured by your tenant administrator.
Navigate to the OpsHub portal URL provided by your administrator.
Sign in using your SSO credentials.
Navigate to Platform Health Dashboard.
The dashboard opens in view-only mode with the default time range applied.
The dashboard is organized into five clearly labeled sections, each covering a distinct area of platform health. Section headers visually separate each area.
Section | What it covers |
Client API | Request volume, success rate, HTTP response status breakdown, and latency percentiles (P50, P80, P95, P99) for client-facing API traffic. |
Back Office API | Request volume, success rate, HTTP response status, and latency percentiles for Back Office (BOA) span-based traffic. |
Playback | Session volume, success rate, and content type trends for playback operations (VOD, LINEAR, TSTV, CDVR). |
Linear Ingest | Success rates and trend charts for full and partial (channel) schedule ingests. |
VOD Ingest | Daily and weekly success rates, plus a status trend bar chart for VOD asset processing. |
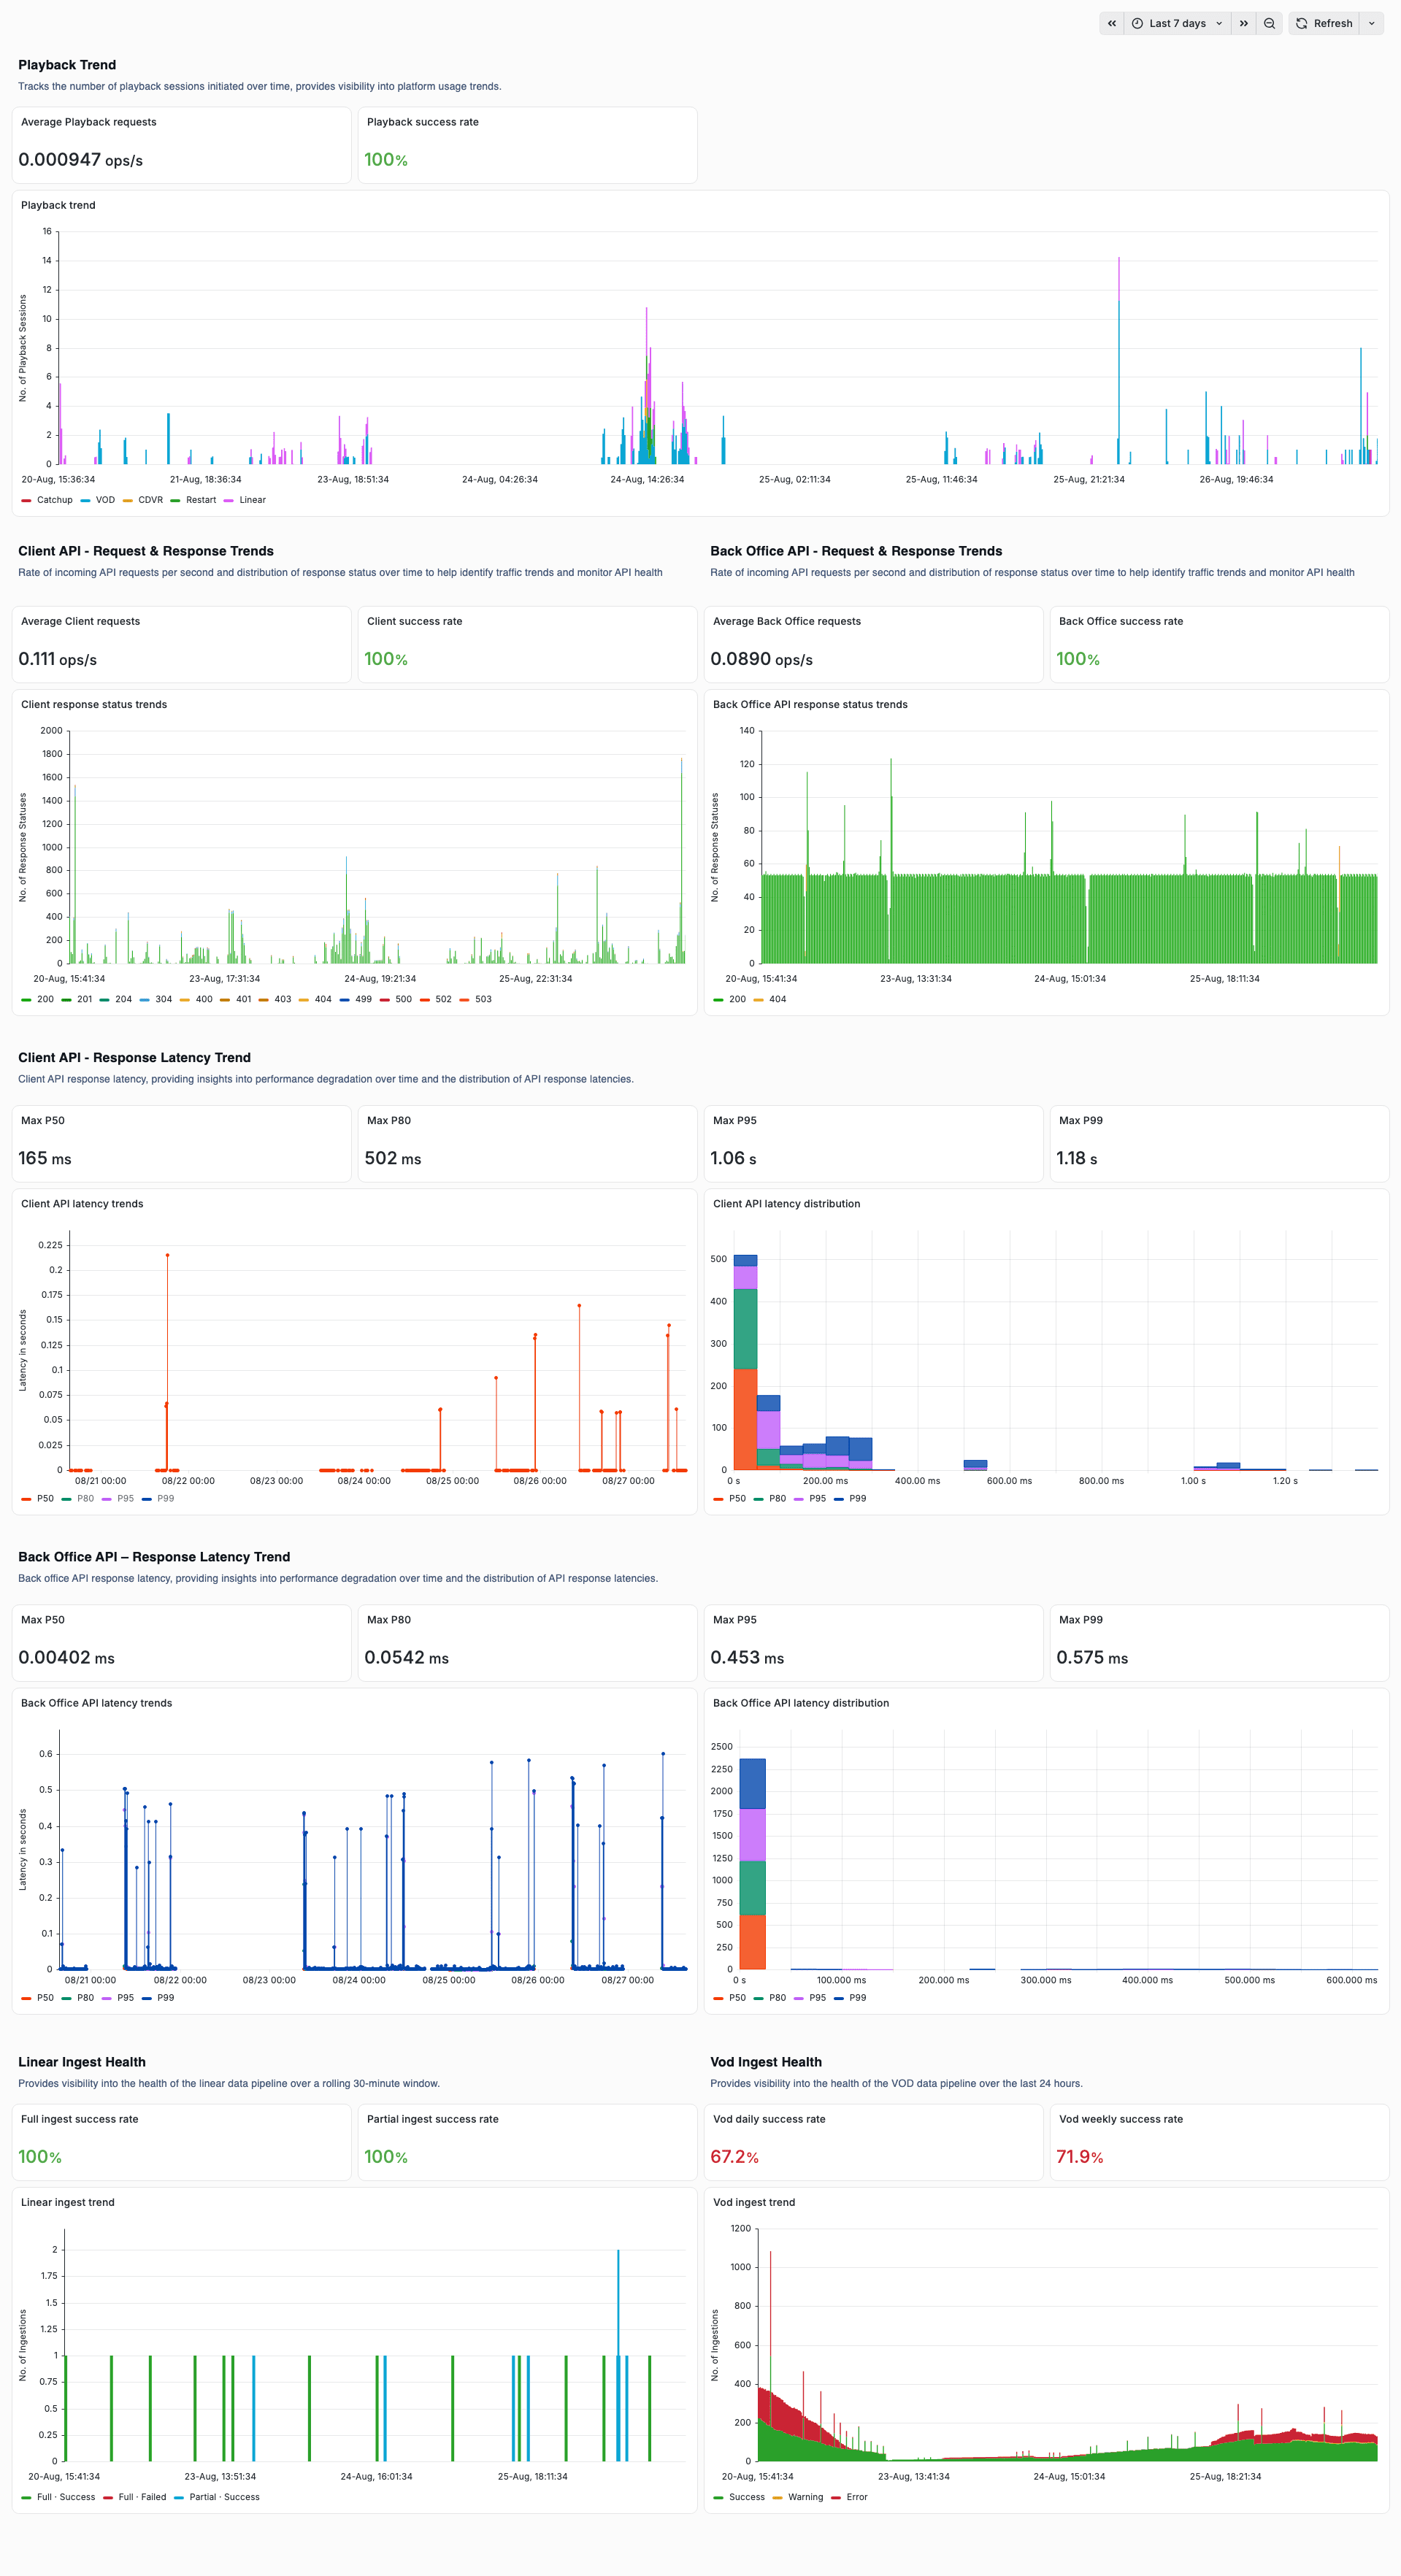
The dashboard uses a global time range selector. All panels inherit this time range — there are no per-panel time overrides. Changing the global time range updates all panels simultaneously.
Last 1 hour — for real-time monitoring during active incidents
Last 24 hours — for daily health review
Last 7 days — for trend analysis and weekly reviews
Custom range — select a specific start and end time
The dashboard supports auto-refresh at configurable intervals. When auto-refresh is enabled, all panels update automatically at the selected frequency.
All Client API, Back Office API, and Playback panels are scoped to the selected tenant. No data from other tenants is visible in any panel. Operators cannot bypass tenant filtering by modifying the URL or using browser developer tools.
Schedule Ingest and VOD Ingest panels are system-wide by design. These metrics represent infrastructure-level operations that are not tenant-specific.
The Client API section monitors the health and performance of client-facing API requests. It uses metrics collected from the Nginx log exporter service.
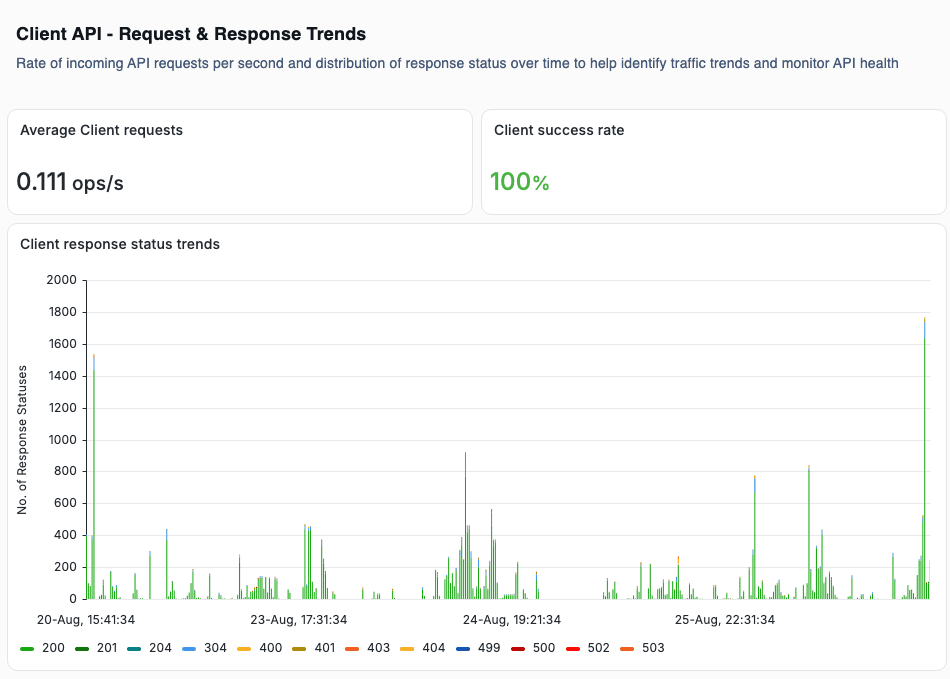
A stat panel showing the rate of incoming Client API requests per second. The value updates when the time range is changed.
The request rate is displayed in operations per second (ops).
Higher values indicate periods of active user traffic.
A sudden drop to zero may indicate a service outage or deployment event.
The stat panel shows the mean value over the selected time range.
A stat panel showing the percentage of Client API requests that completed without a 5xx server error. Only HTTP 5xx responses are counted as errors.
Color | Condition | Meaning |
Green | Success rate >= 99.8% | Normal — the API is operating within acceptable limits. |
Red | Success rate < 99.8% | Degraded — investigate the HTTP response status breakdown for 5xx errors. |
A value of 100% means no 5xx errors occurred in the selected time range.
Values below 99.8% trigger a red indicator — check the bar chart for error distribution.
The success rate never exceeds 100% and is never negative.
A bar chart showing the distribution of HTTP response status codes over time. Each status code appears as a distinct color-coded series.
Category | Codes | Meaning |
Success | 200, 201, 204 | Successful requests — normal operation. |
Redirect | 304 | Not Modified — client cache hit. |
Client Error | 400, 401, 403, 404 | Client-side errors — authentication failures, bad requests, or missing resources. |
Server Error | 500, 503 | Server-side errors — these count toward the success rate degradation. |
Other | 499 | Client closed connection — typically not a server issue. |
A healthy system shows a dominant 200 series with minimal 5xx values.
Spikes in 401 or 403 may indicate authentication or permission issues.
Spikes in 500 or 503 correlate with success rate drops — investigate the service logs.
Four stat panels display Client API response latency at the P50, P80, P95, and P99 percentiles. Each panel shows the maximum percentile value over the selected time range.
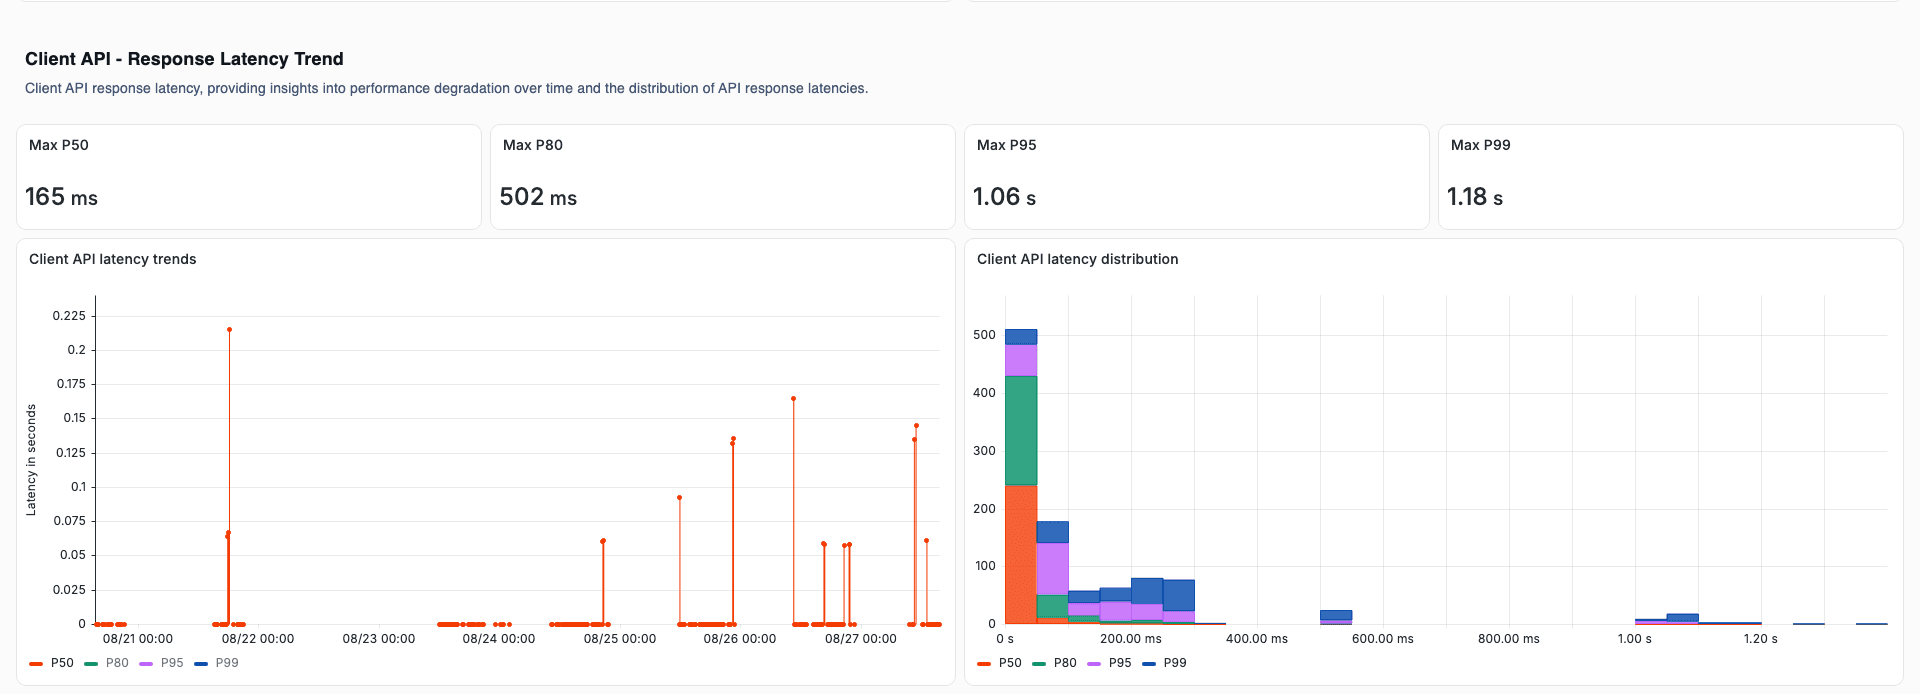
Panel | Percentile | Interpretation |
P50 | 50th percentile (median) | Half of all requests complete faster than this value. |
P80 | 80th percentile | 80% of requests complete faster than this value. |
P95 | 95th percentile | Only 5% of requests take longer than this value. |
P99 | 99th percentile | Only 1% of requests take longer — tail latency indicator. |
Latency values are displayed in seconds.
P50 should always be lower than or equal to P99.
A rising P99 with stable P50 indicates tail latency issues affecting a small number of requests.
A histogram panel shows the distribution of Client API response times across latency buckets. This helps identify whether latency follows a normal distribution or has multi-modal peaks.
A timeseries panel shows latency percentiles plotted over time, allowing operators to identify trends, regressions, or improvements in API response time.
The Back Office API section monitors health and performance of internal Back Office (BOA) service traffic. It uses span-based telemetry from the BOA service.
A stat panel showing the rate of Back Office API requests per second, calculated from span counts.
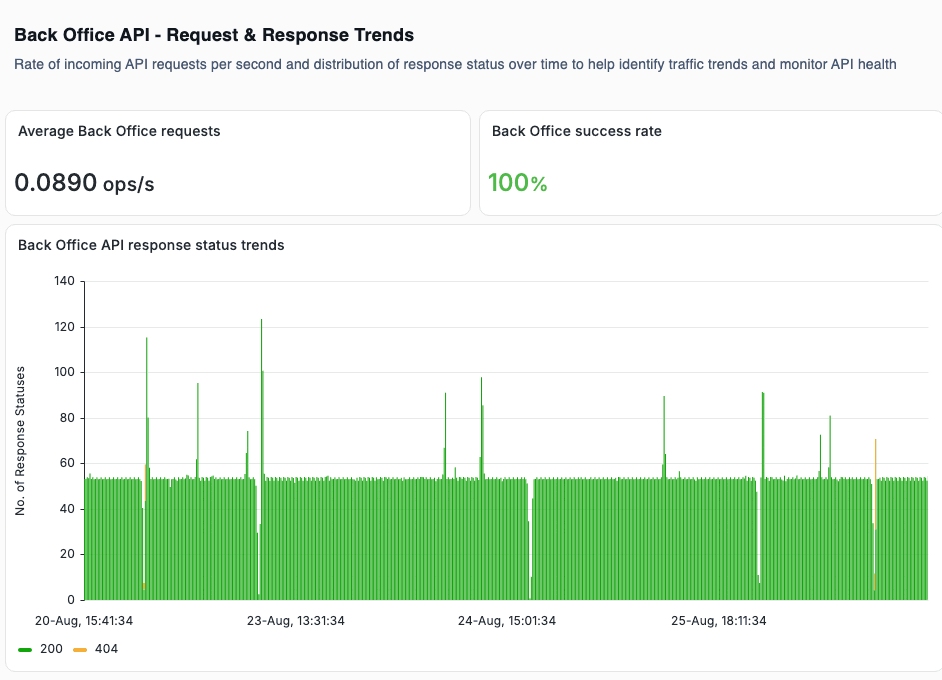
The rate is displayed in operations per second (ops).
Back Office traffic is typically consistent — steady values around 0.08-0.11 ops indicate normal behavior.
Drops in rate may indicate service interruptions.
A stat panel showing the percentage of Back Office API requests that completed without a 5xx server error. Only HTTP 5xx responses (matched via regex) are counted as errors.
When no 5xx errors exist, the success rate panel may display 'No data' — this indicates 100% success.
This behavior is expected — the calculation requires error data to produce a result.
Check the response status bar chart to confirm there are no 5xx status codes.
A bar chart showing Back Office response status codes grouped over time. Each HTTP status code appears as a separate series.
A healthy system shows predominantly 200 responses.
The presence of 404 responses is normal for certain lookup operations.
Any appearance of 500 or 503 codes should be investigated.
Four stat panels (P50, P80, P95, P99) display Back Office latency in milliseconds. A histogram and timeseries panel provide distribution and trend views.
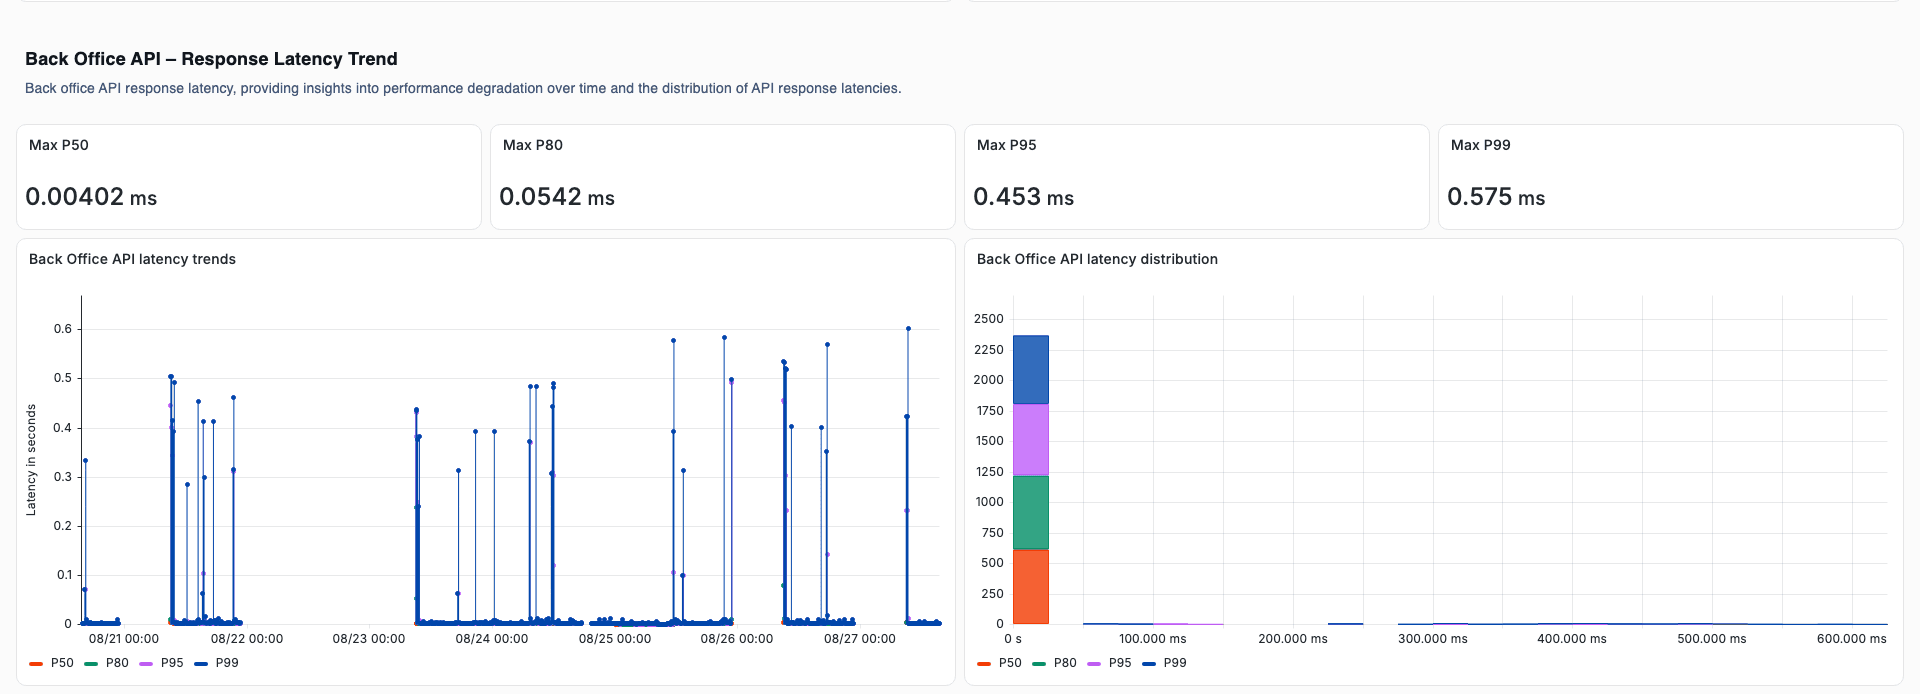
Back Office latency is measured in milliseconds (ms), not seconds.
Typical P50 values are sub-1ms and P99 values are under 1ms.
The P50 value should always be less than or equal to P99.
Rising latency across all percentiles may indicate infrastructure load.
The Playback section monitors session volumes, success rates, and content type distribution for playback operations.
A stat panel showing the rate of playback sessions initiated, displayed in operations per second (ops).
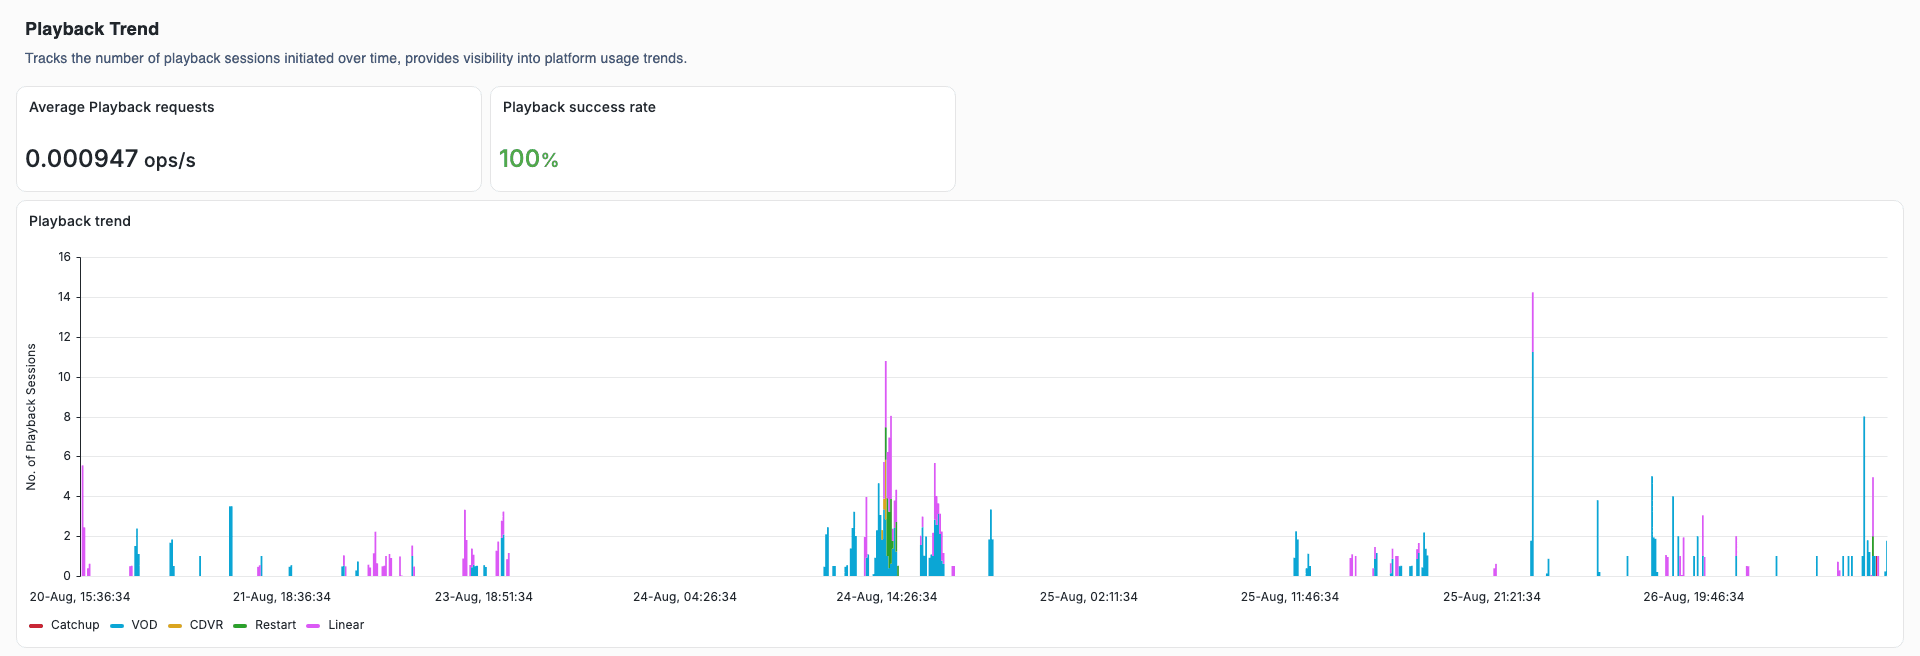
Session rates vary based on time of day and user activity.
Zero sessions during expected viewing hours may indicate a service issue.
A bar chart showing playback sessions grouped by content type over time.
Content type | Description |
VOD | Video on demand — the most common content type. |
LINEAR | Live television channels. |
TSTV-RESTART | Restart TV — allows restarting a live program from the beginning. |
TSTV-CATCHUP | Catch-up TV — allows viewing past programs within a retention window. |
CDVR | Cloud DVR — recorded content stored in the cloud. |
VOD and LINEAR typically dominate the content mix.
A sudden absence of a content type may indicate a content delivery issue.
All values should be non-negative.
A stat panel showing the percentage of playback sessions that completed without error. Sessions where the error field is not 'None' are counted as failures.
The success rate is displayed as a percentage (0-100%) and never exceeds 100%.
Lower playback success rates in dev or test environments are expected due to test traffic.
In production, playback success rates below 95% warrant investigation.
The Linear Ingest section monitors the health of schedule ingest operations — both full schedule ingests and partial (channel-level) ingests.
A stat panel showing the percentage of full schedule ingests that completed successfully. Non-success results are counted as errors.
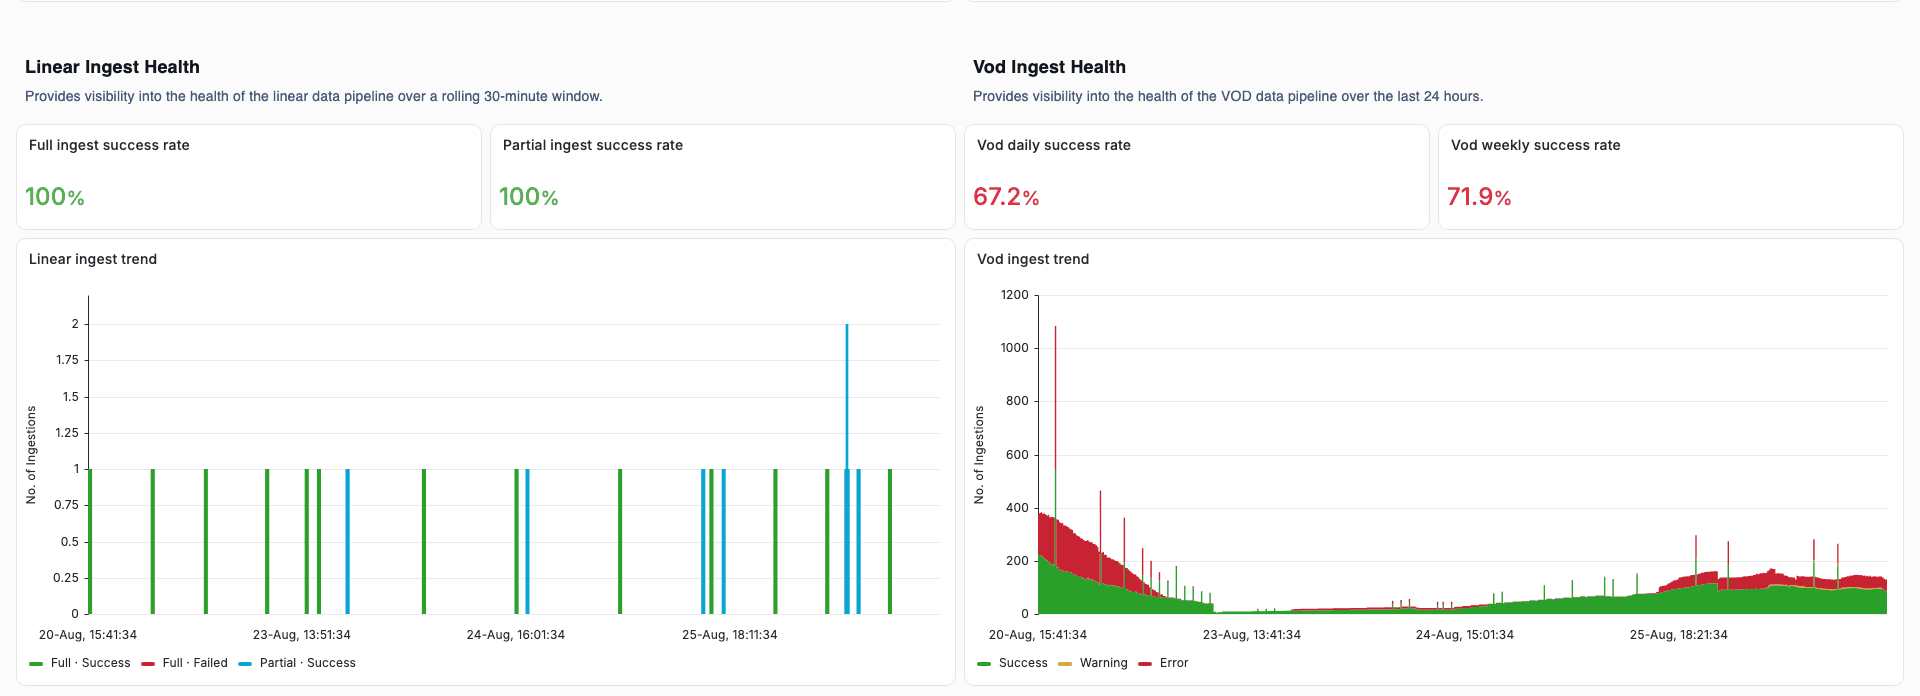
A value of 100% means all full schedule ingests succeeded.
When no errors exist, the panel may display 'No data' — this indicates 100% success.
Ingest metrics use a 30-minute delta window matching the ingest processing cadence.
Schedule ingests are system-wide — they are not filtered by tenant.
A stat panel showing the success rate for channel-level (partial) schedule ingests. These are individual channel updates processed between full ingests.
A bar chart showing successful and failed ingest counts over time for both full and partial ingests. Values are rounded to whole numbers.
Series | Description |
Full Success | Number of successful full schedule ingests per time period. |
Full Fail | Number of failed full schedule ingests per time period. |
Channel Success | Number of successful partial (channel) ingests per time period. |
Channel Fail | Number of failed partial ingests per time period. |
In a healthy system, fail counts are zero and success counts match the expected ingest cadence.
All bar values are whole numbers (the round function is applied).
A rise in fail counts should be investigated immediately.
The VOD Ingest section monitors the health of VOD asset processing. It uses gauge-style metrics from the VOD tracker service.
A stat panel showing the VOD ingest success rate for the last 24 hours. Assets with an 'error' status are counted as failures.
The value is between 0% and 100%.
Daily success rates fluctuate more than weekly rates due to the shorter time window.
A sudden drop below 90% warrants investigation of the VOD processing pipeline.
A stat panel showing the VOD ingest success rate over the last 7 days. This provides a more stable view of VOD health than the daily rate.
Weekly rates are typically lower than daily peaks because they average more data.
Consistent weekly rates indicate stable VOD processing.
A bar chart showing VOD asset counts grouped by processing status over time.
Status | Description |
Success | VOD assets that completed processing successfully. |
Warning | VOD assets that completed with non-critical issues. |
Error | VOD assets that failed processing — counted toward the error rate. |
A healthy system shows a dominant success series with minimal errors.
Warning status may not require immediate action but should be monitored.
Error spikes correlate with drops in the daily and weekly success rates.
The dashboard uses color-coded thresholds and visual indicators to support rapid triage. These are applied to stat panels to communicate system status at a glance.
Color | Meaning | Applied to |
Green | Normal — metric is within acceptable range | Success rate panels (>= 99.8%) |
Red | Degraded — metric has crossed the warning threshold | Success rate panels (< 99.8%) |
Green (latency) | Normal — latency is within expected range | Latency stat panels |
Type | Used for | Example panels |
Stat | Single-value metrics (rate, percentage, percentile) | Request volume, success rate, latency P50/P80/P95/P99 |
Bar chart | Category-grouped values over time | HTTP status codes, content types, ingest success/fail counts, VOD status |
Timeseries | Line graphs of metrics over time | Latency trends |
Histogram | Distribution of values across buckets | Latency distribution |
Text | Section headers and labels | Section dividers between dashboard areas |
Some panels may display 'No data' under certain conditions. This does not always indicate a problem.
Success rate panels show 'No data' when there are zero errors — this means 100% success.
The selected time range has no traffic (e.g., overnight hours in a dev environment).
The tenant variable is not correctly set in the URL.
The P50 (median) latency stat panel may show 0 when the majority of requests complete within the smallest histogram bucket boundary. This is normal for fast services.
Open the Platform Health Dashboard from the OpsHub portal.
Verify the tenant selector shows the correct tenant.
Set the time range appropriate to your review (1h for live, 7d for trends).
Check all success rate stat panels — green indicates healthy, red requires attention.
Review HTTP response status bar charts for any 5xx error spikes.
Check latency percentiles for unusual increases.
Review ingest health panels for any failed ingests.
Check VOD processing status for error trends.
If issues are found, correlate the timestamp with service logs for root cause analysis.
Start with the success rate panels — they provide the fastest health signal.
Use the 7-day view for weekly reviews and the 1-hour view during active incidents.
Compare latency P50 and P99 — a large gap indicates tail latency affecting some users.
Check ingest panels even when API health looks normal — ingest failures can be silent.
Note that 'No data' on success rate panels is normal when there are zero errors.
For questions or access issues, contact your tenant administrator or the platform operations team.
